DevOps篇-Prometheus+Grafana搭建监控大盘

image.png

简介

Prometheus

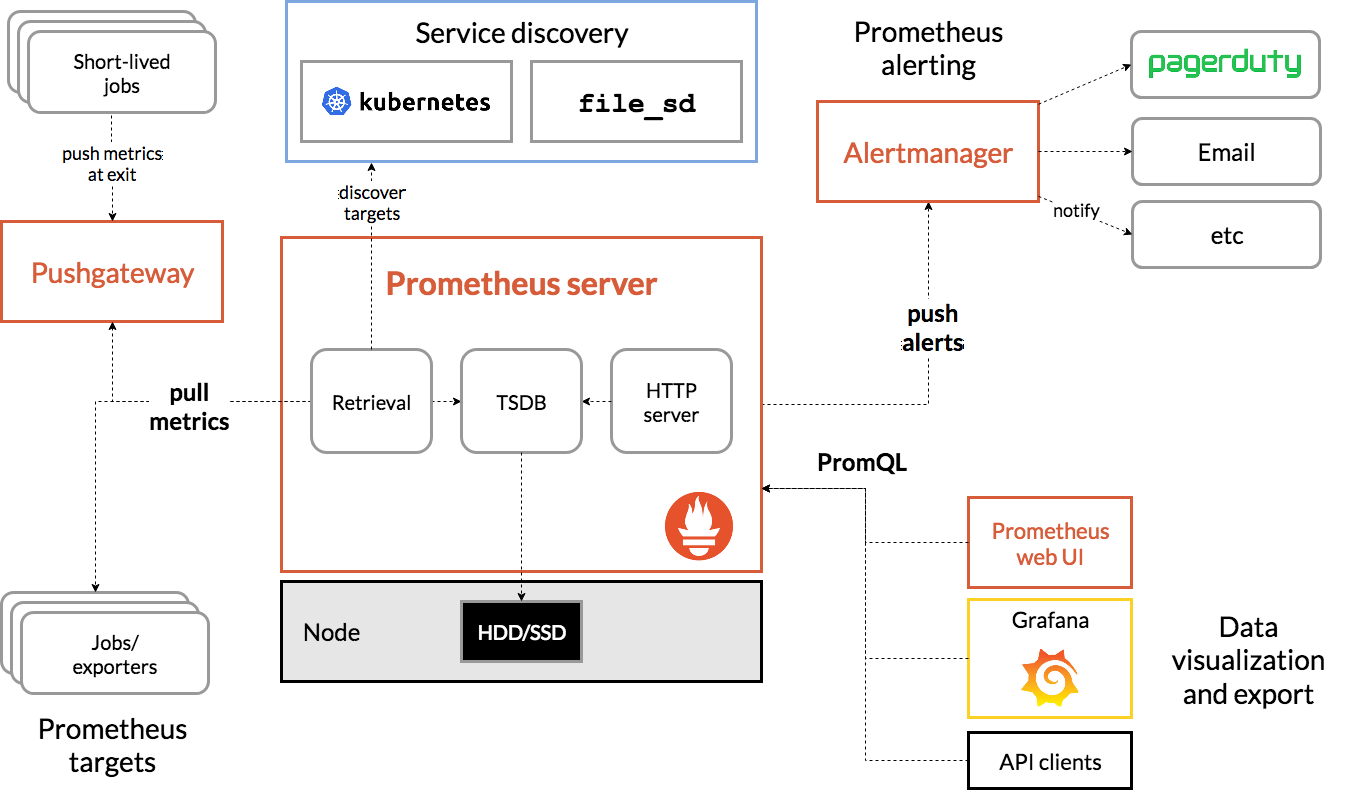
Prometheus is an open-source systems monitoring and alerting toolkit originally built at SoundCloud. Since its inception in 2012, many companies and organizations have adopted Prometheus, and the project has a very active developer and user community. It is now a standalone open source project and maintained independently of any company. To emphasize this, and to clarify the project’s governance structure, Prometheus joined the Cloud Native Computing Foundation in 2016 as the second hosted project, after Kubernetes.
For more elaborate overviews of Prometheus, see the resources linked from the media section.

注意

根据需要选择安装对应的exporter,当然需要监控应用的话还需要在应用提供监控的数据,以SpringBoot应用为例。将Prometheus引入依赖如下:

1
2
3
4
5
6
7
8
<dependency>
<groupId>org.springframework.boot</groupId>
<artifactId>spring-boot-starter-actuator</artifactId>
</dependency>
<dependency>
<groupId>io.micrometer</groupId>
<artifactId>micrometer-registry-prometheus</artifactId>
</dependency>

对于Springboot,要开启Actuator,并打开对应的Endpoint

1
2
3
management.endpoints.web.exposure.include=*
# 或者
management.endpoints.web.exposure.include=prometheus

启动Springboot后,可以通过下面URL看能不能正确获取到监控数据:

1
localhost:8080/actuator/prometheus

获取数据成功,说明Springboot能正常提供监控数据。

安装

1
2
3
4
5
6
7
8
9
10
# 下载prometheus
wget https://github.com/prometheus/prometheus/releases/download/v2.26.0/prometheus-2.26.0.linux-amd64.tar.gz
# 下载mysqld_exporter
wget https://github.com/prometheus/mysqld_exporter/releases/download/v0.13.0-rc.0/mysqld_exporter-0.13.0-rc.0.linux-amd64.tar.gz
# 下载node_exporter
wget https://github.com/prometheus/node_exporter/releases/download/v1.1.2/node_exporter-1.1.2.linux-amd64.tar.gz
# 下载grafana
wget https://dl.grafana.com/oss/release/grafana-7.5.5.linux-amd64.tar.gz
# 下载alertmanager
wget https://github.com/prometheus/alertmanager/releases/download/v0.21.0/alertmanager-0.21.0.linux-amd64.tar.gz

配置

prometheus文件配置

1
2
3
4
5
6
7
8
9
10
11
12
13
14
15
16
17
18
19
20
21
22
23
24
25
26
27
28
29
30
31
32
33
34
35
36
37
38
39
40
41
# my global config
global:
scrape_interval: 15s # Set the scrape interval to every 15 seconds. Default is every 1 minute.
evaluation_interval: 15s # Evaluate rules every 15 seconds. The default is every 1 minute.
# scrape_timeout is set to the global default (10s).

# Alertmanager configuration
alerting:
alertmanagers:
- static_configs:
- targets:
# - alertmanager:9093

# Load rules once and periodically evaluate them according to the global 'evaluation_interval'.
rule_files:
# - "first_rules.yml"
# - "second_rules.yml"

# A scrape configuration containing exactly one endpoint to scrape:
# Here it's Prometheus itself.
scrape_configs:
# The job name is added as a label `job=<job_name>` to any timeseries scraped from this config.
- job_name: 'prometheus'
# metrics_path defaults to '/metrics'
# scheme defaults to 'http'.

static_configs:
- targets: ['localhost:9090']
#应用
- job_name: 'order'
metrics_path: '/actuator/prometheus'
static_configs:
- targets: ['127.0.0.1:8080']
#数据库
- job_name: 'mysql_export'
static_configs:
- targets: ['127.0.0.1:9104']
#主机
- job_name: 'node_export'
static_configs:
- targets: ['127.0.0.1:9100']

mysql-exporter需要在当前目录下新建一个my.cnf配置文件

1
2
3
[client]
user=root
password=123456

启动

1
2
3
4
5
6
7
8
# 启动主机数据采集
nohup ./node_exporter &
# 启动普罗米修斯
nohup ./prometheus &
# 启动数据库数据采集
nohup ./mysqld_exporter &
# 启动grafana
nohup ./grafana_server &

面板

你可以添加自定义的面板也可以导入其他人的、通过其id或网址导入dashboards

资料

grafana官网
prometheus官网


DevOps篇-Prometheus+Grafana搭建监控大盘
https://mikeygithub.github.io/2021/05/05/yuque/DevOps篇-Prometheus+Grafana搭建监控大盘/
作者
Mikey
发布于
2021年5月5日
许可协议