简介 Prometheus 是一个开源的服务监控系统和时间序列数据库
安装
下载
1 wget https://github.com/prometheus/prometheus/releases/download/v2.42.0/prometheus-2.42.0.linux-arm64.tar.gz
解压
1 tar zxvf prometheus-2.42.0.linux-arm64.tar.gz
配置
1
2
3
4
5
6
7
8
9
10
11
12
13
14
15
16
17
18
19
20
21
scrape_configs: - job_name: 'prometheus' static_configs: - targets: ['localhost:9090' ]- job_name: 'order' metrics_path: '/actuator/prometheus' static_configs: - targets: ['127.0.0.1:8080' ]- job_name: 'mysql_export' static_configs: - targets: ['127.0.0.1:9104' ]- job_name: 'node_export' static_configs: - targets: ['127.0.0.1:9100' ]
运行
1 ./prometheus --config.file=prometheus.yml
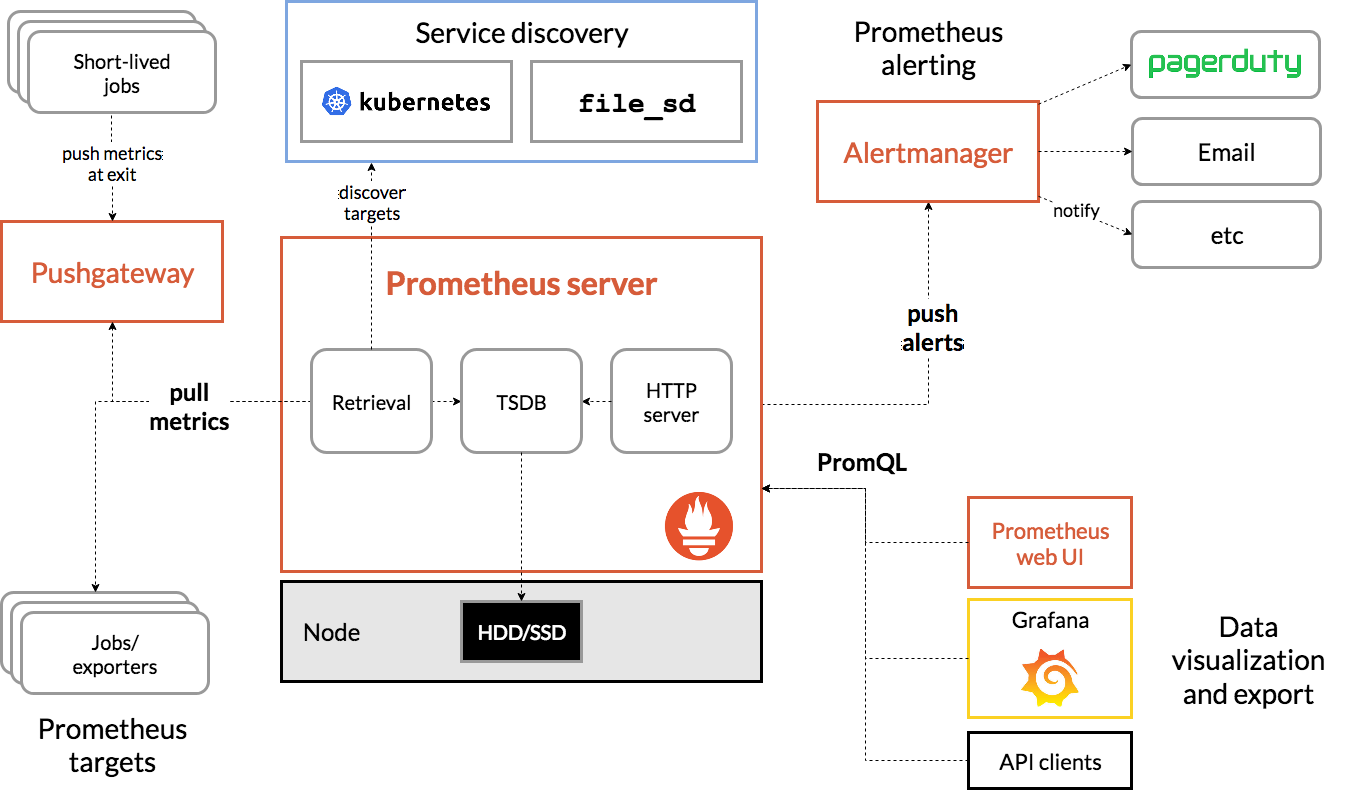
架构
查询 Prometheus提供了一种称为PromQL(PrometheusQueryLanguage)的函数查询语言,它允许用户实时选择和聚合时间序列数据。表达式的结果可以显示为图形,在Prometheus的表达式浏览器中显示为表格数据,也可以由外部系统通过HTTP API使用。
基础 表达式类型
瞬时向量(Instant vector) : 一组时间序列,包含每个时间序列的单个样本,所有样本共享相同的时间戳范围向量(Range vector) : 一组时间序列,包含每个时间序列随时间变化的数据点范围标量(Scalar) : 一个简单的数字浮点值字符串(String) : 一个简单的字符串值;当前未使用
操作 函数 案例 HTTP API REMOTE READ API 应用
将应用接入prometheus,在github找到对应语言的client,一些以go为案例
client:https://github.com/prometheus/client_golang
构建应用
1
2
3
4
go mod init go get github.com/prometheus/client_golang/prometheus go get github.com/prometheus/client_golang/prometheus/promauto go get github.com/prometheus/client_golang/prometheus/promhttp
编写http指标采集入口
1
2
3
4
5
6
7
8
9
10
11
12
13
14
15
16
17
18
19
20
21
22
23
24
25
26
27
28
29
30
31
32
package mainimport ("net/http" "time" "github.com/prometheus/client_golang/prometheus" "github.com/prometheus/client_golang/prometheus/promauto" "github.com/prometheus/client_golang/prometheus/promhttp" func recordMetrics () go func () for {2 * time.Second)var ("app_processed_ops_total" ,"The total number of processed events" ,func main () "/metrics" , promhttp.Handler())":8088" , nil )
配置prometheus.yaml
1
2
3
4
5
6
scrape_configs: - job_name: myapp scrape_interval: 10s static_configs: - targets: - localhost:8088
运行应用
1 nohup ./main 2 >1 1 >/dev/null &
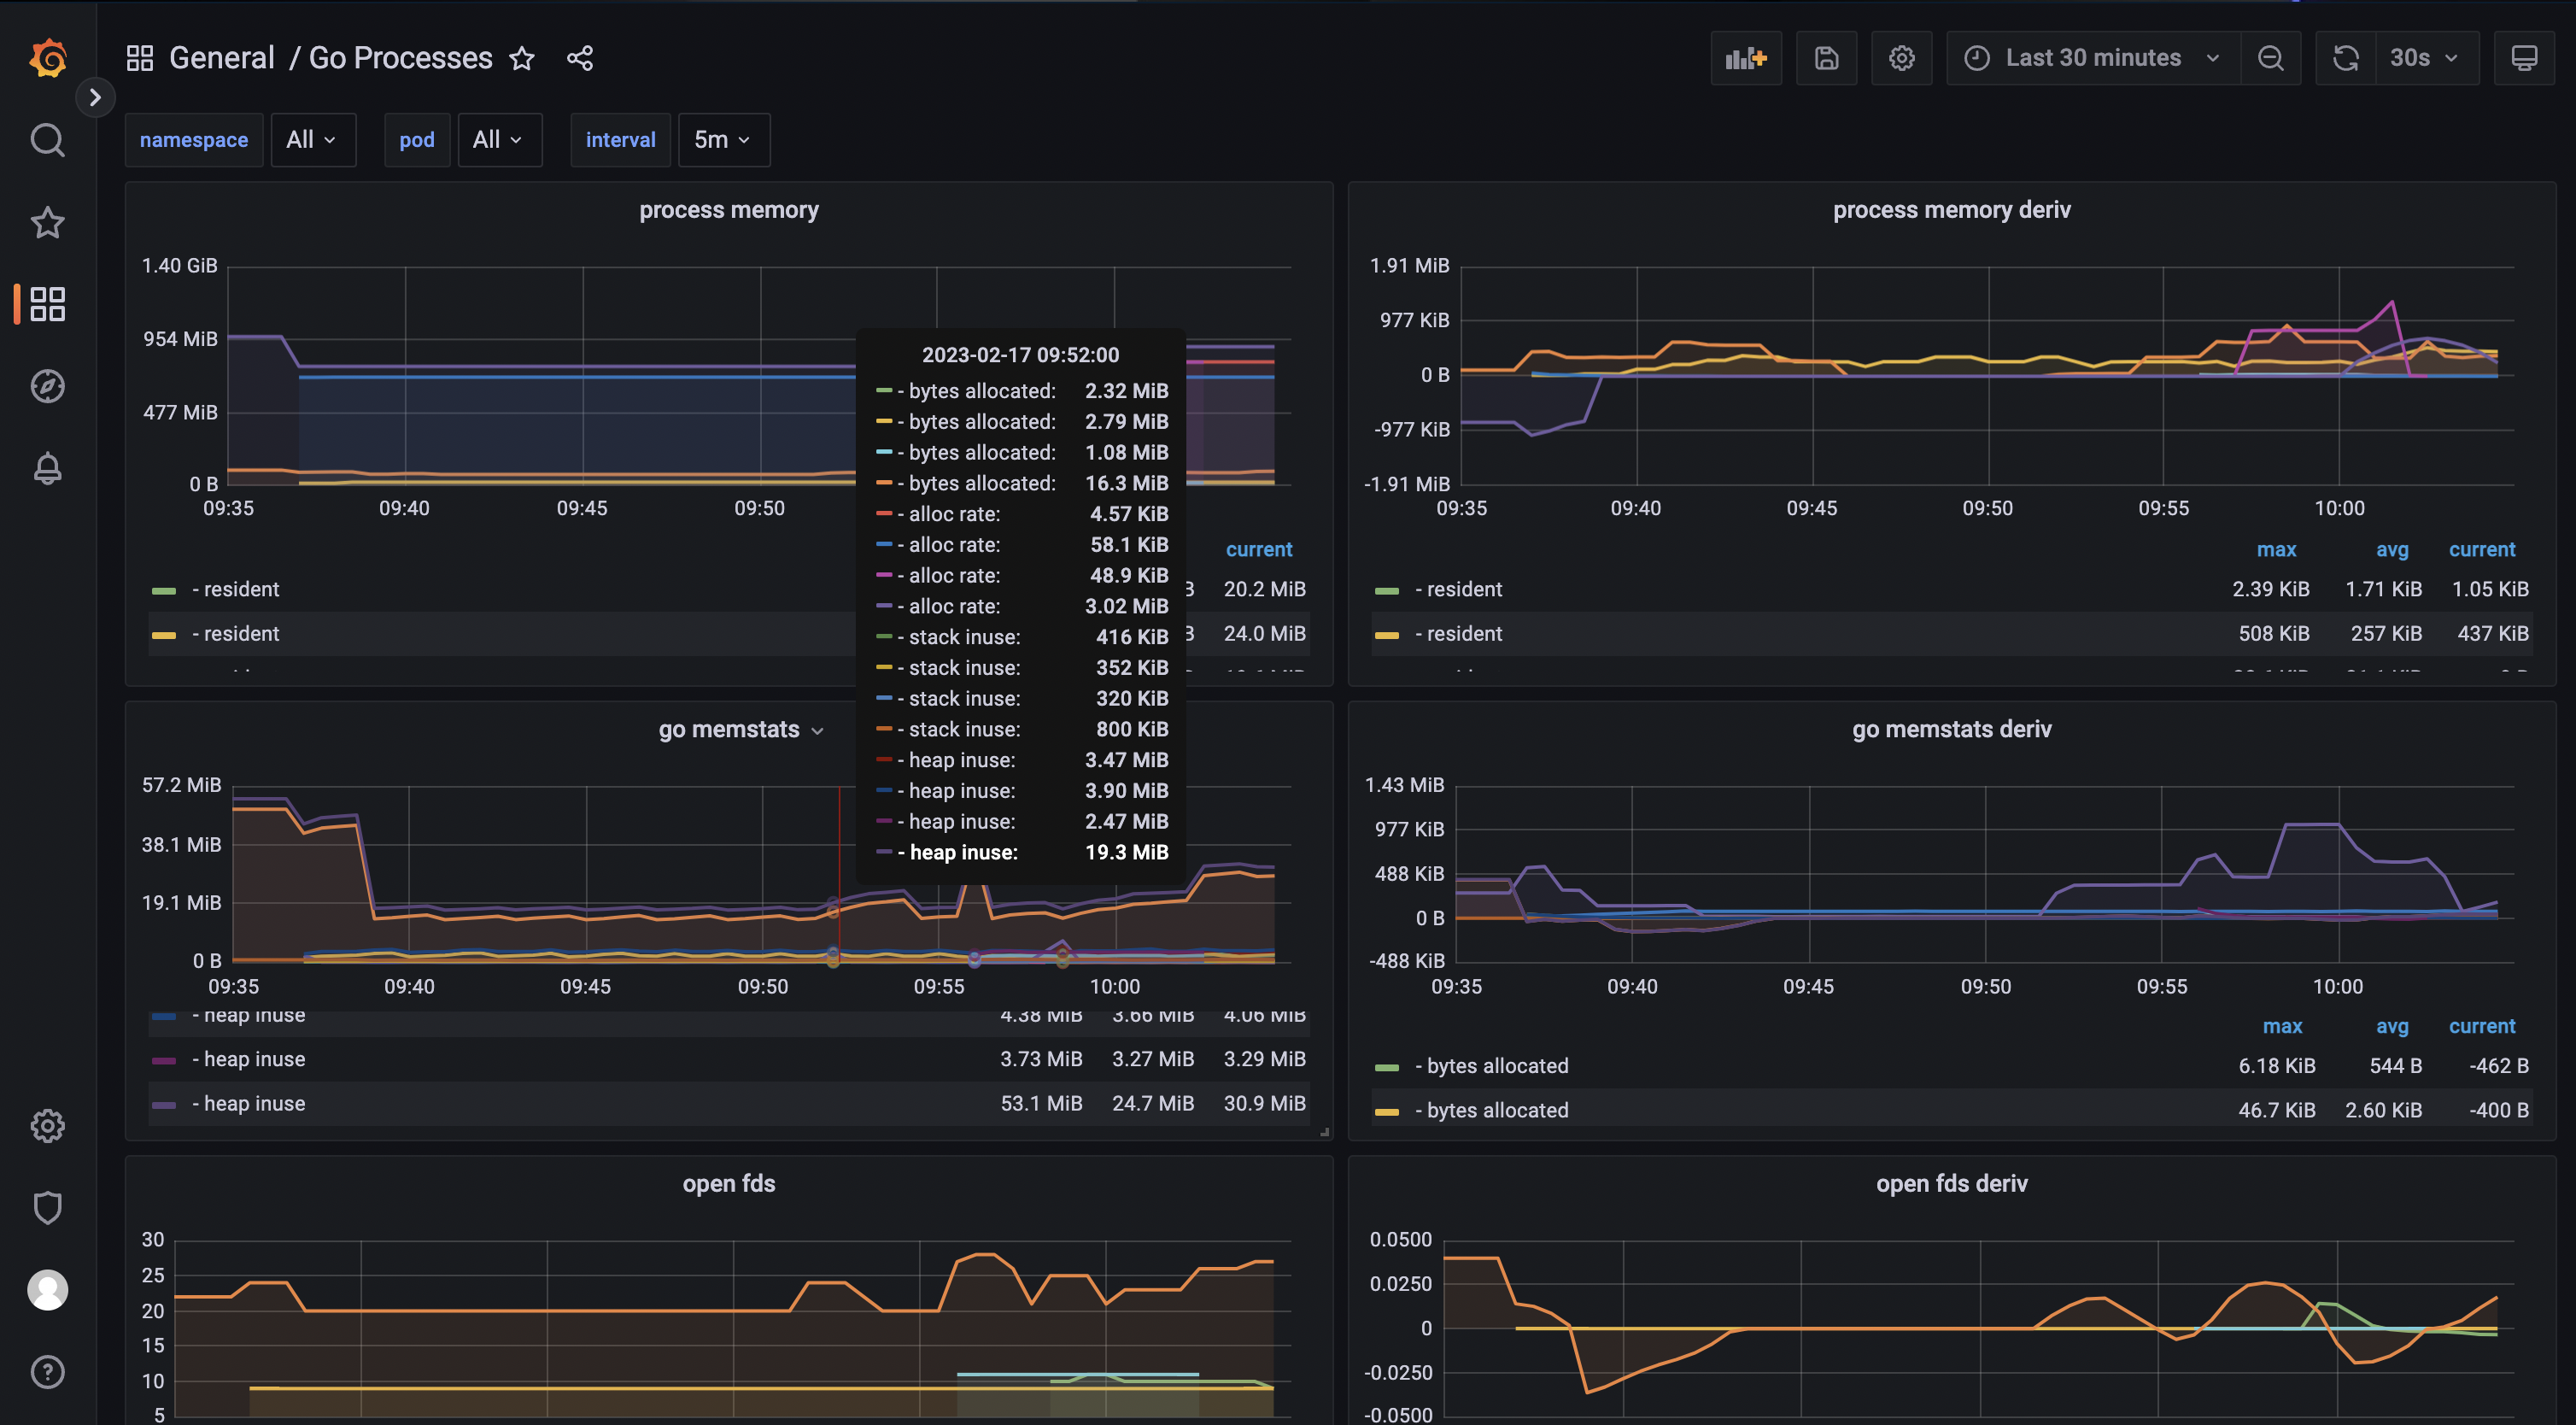
导入大盘,当然你也可以自定义
官网搜索地址:https://grafana.com/grafana/dashboards/
查看大盘
参考资料:https://prometheus.io/docs/guides/go-application/
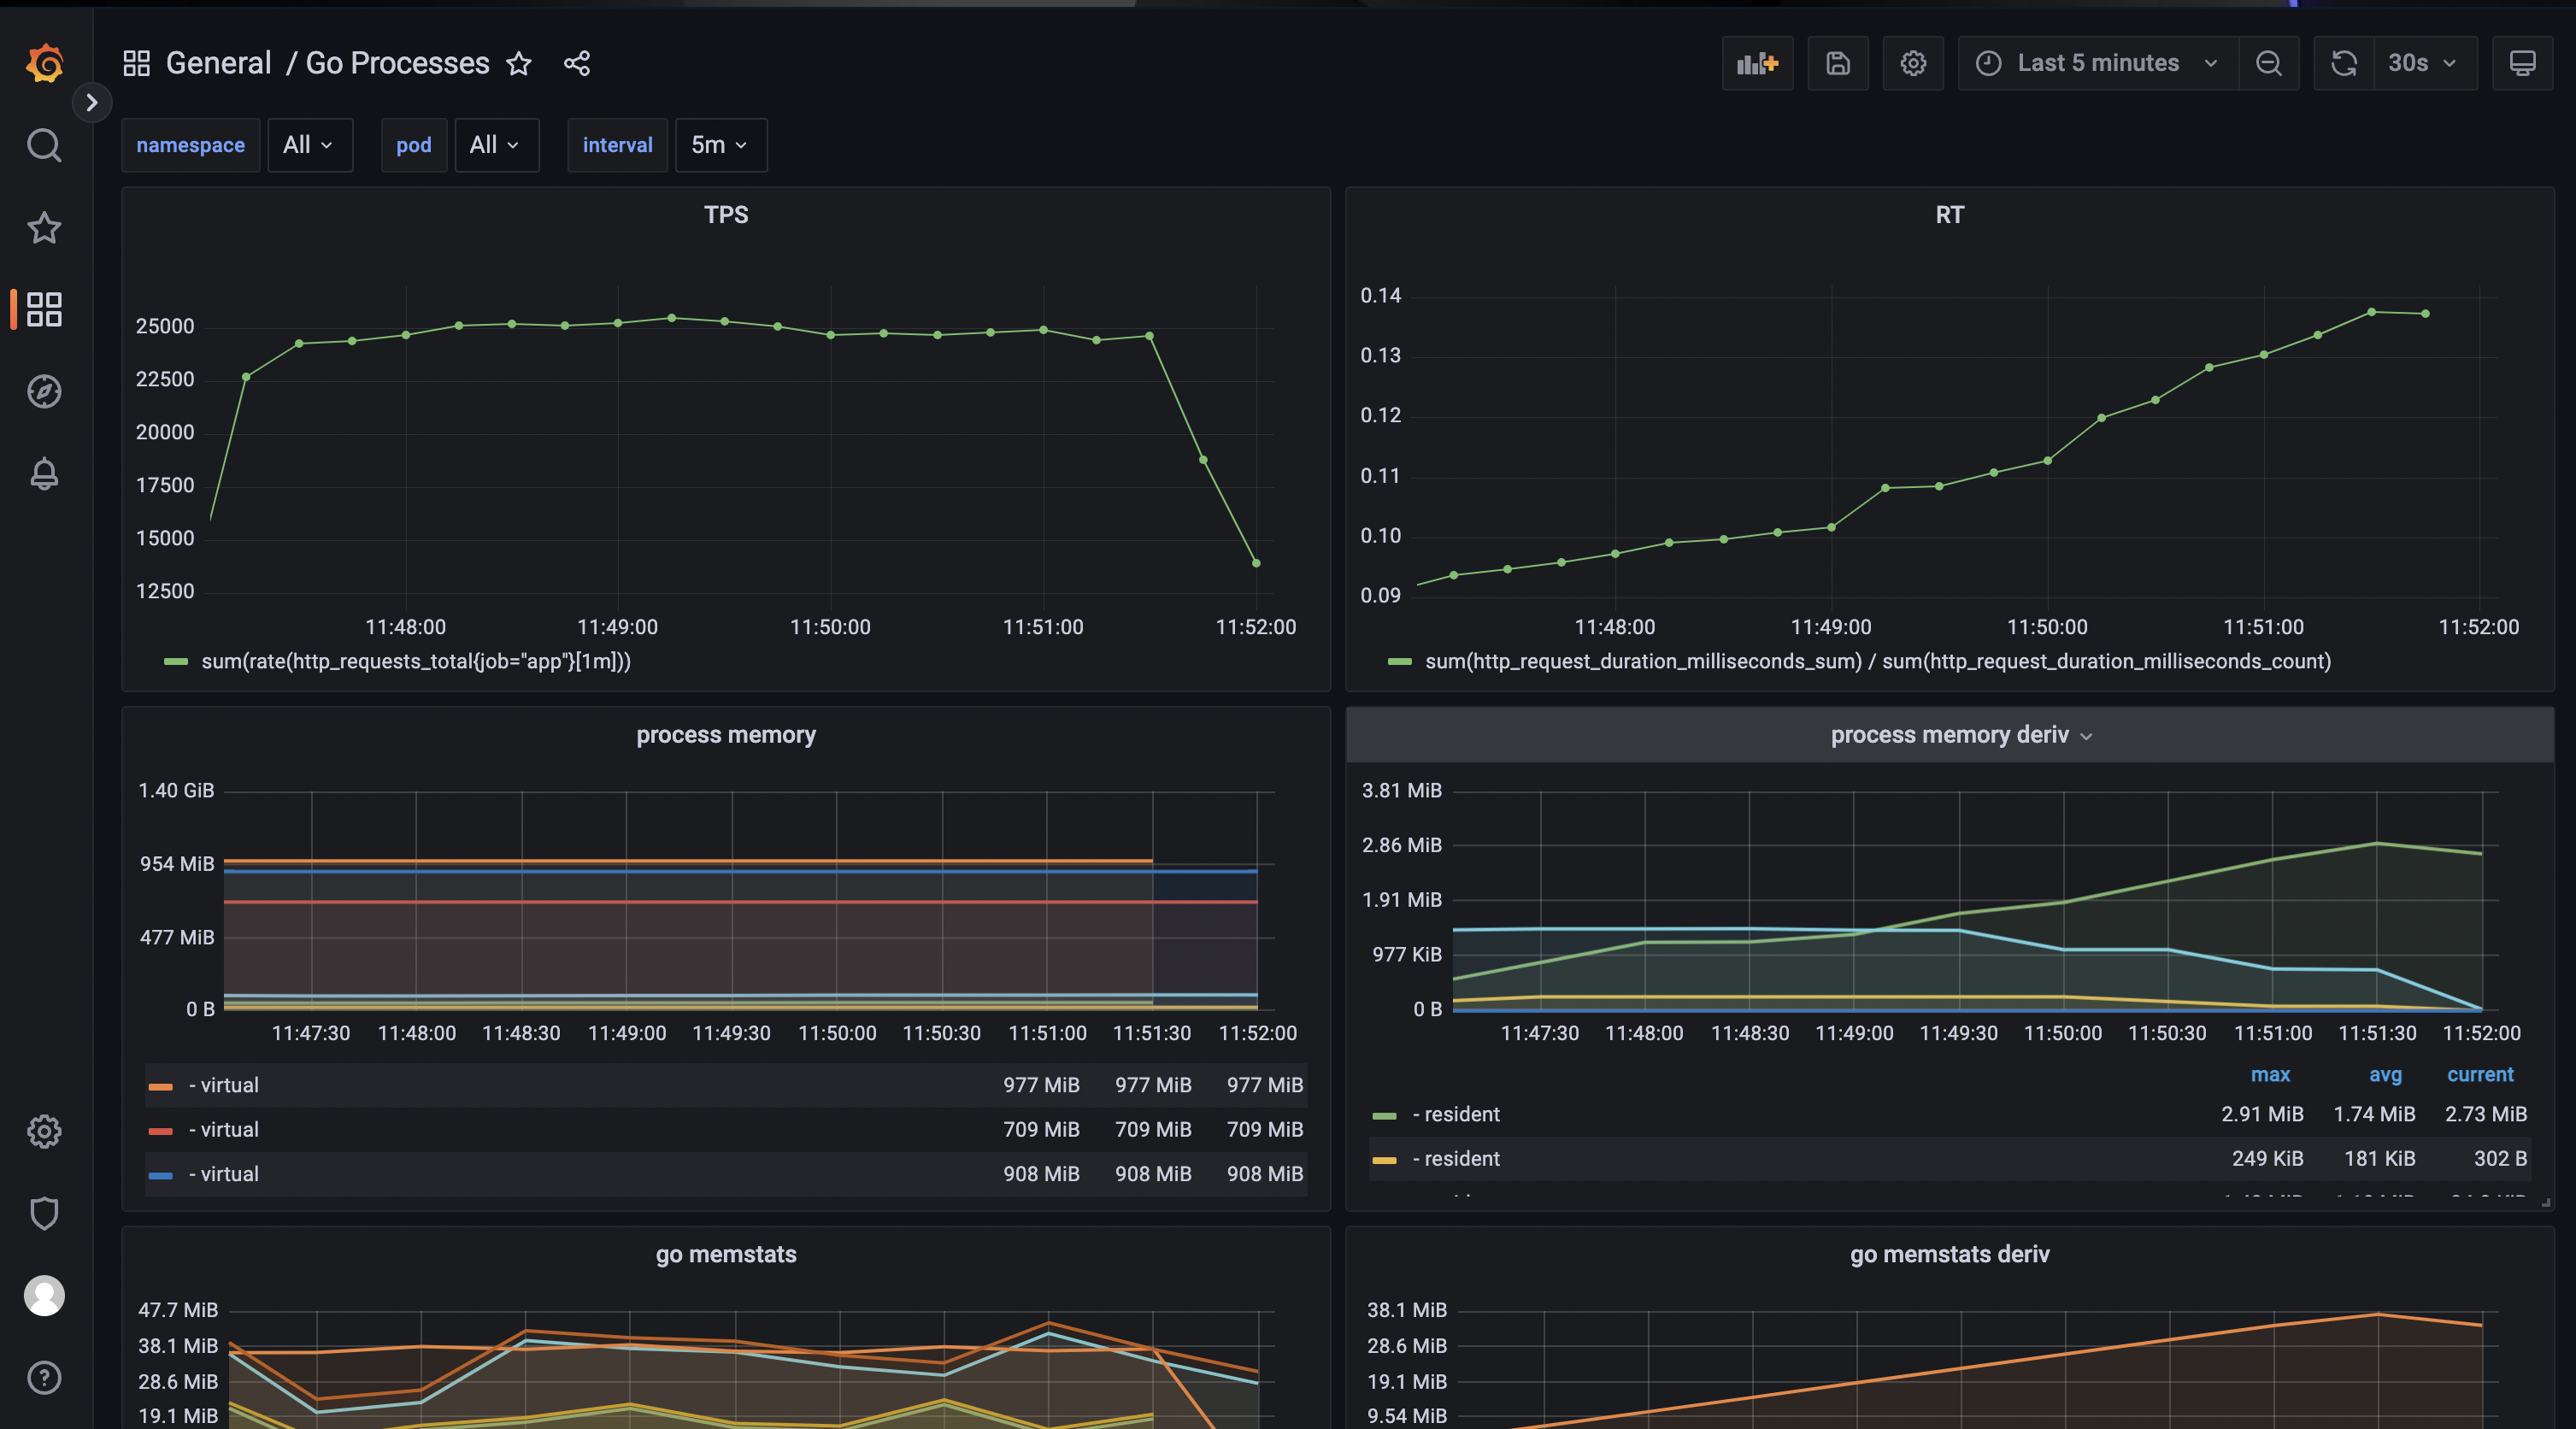
案例 配置RT/TPS 应用提供指标 1 2 3 4 5 6 7 8 9 10 11 12 13 14 15 16 17 18 19 20 21 22 23 24 25 26 27 28 29 30 31 32 33 34 35 36 37 38 39 40 41 42 43 44 45 46 47 48 49 50 51 52 53 54 55 56 57 58 59 60 61 62 63 package mainimport ("fmt" "log" "net/http" "time" "github.com/prometheus/client_golang/prometheus" "github.com/prometheus/client_golang/prometheus/promhttp" var ("http_request_duration_milliseconds" ,"HTTP request duration distribution." ,float64 {10 , 50 , 100 , 200 , 500 , 1000 , 2000 , 5000 },"http_requests_total" ,"Total number of HTTP requests." ,func init () func main () "/metrics" , promhttp.Handler())"/ok" , http.HandlerFunc(func (writer http.ResponseWriter, request *http.Request) float64 (duration.Nanoseconds()) / 1e6 byte (time.Now().Format("2006-01-02 15:04:05" )))":8088" , nil )func service () "2006-01-02 15:04:05" ))40 )func fib (n int ) int {if n == 1 || n == 2 {return nreturn fib(n-1 ) + fib(n-2 )
配置查询指标 1 2 sum(rate(http_requests_total{job="app"}[1m])) sum(http_request_duration_milliseconds_sum) / sum(http_request_duration_milliseconds_count)
资料
https://prometheus.io/ https://github.com/prometheus