Grafana 监控可观测平台

简介
grafana是一款集指标监控、可视化、警报一体的平台
特点
- 可视化:具有多种选项的快速灵活的客户端图形。面板插件提供了许多不同的方法来可视化度量和日志。
- 动态仪表板:使用模板变量创建动态和可重复使用的仪表板,这些模板变量显示为仪表板顶部的下拉列表。
- 探索指标:通过特殊查询和动态向下钻取来探索数据。拆分视图并并排比较不同的时间范围、查询和数据源。
- 探索日志:体验从指标切换到带有保留标签过滤器的日志的魔力。快速搜索所有日志或实时流媒体。
- 警报:直观地定义最重要指标的警报规则。
- 混合数据源:在同一图表中混合不同的数据源,可以基于每个查询指定数据源。适用于自定义数据源。
安装
下载
- 下载granfan
1 | |
- 下载Prometheus https://prometheus.io/download/
1 | |
安装
- 启动 granfan
1 | |
- 启动node_exporter
1 | |
- 配置并启动Prometheus
1 | |
1 | |
需要注意一下服务器的时间,笔者因为这个原因导致grafana一直服务获取prometheus数据,需要删除data目录重新启动即可
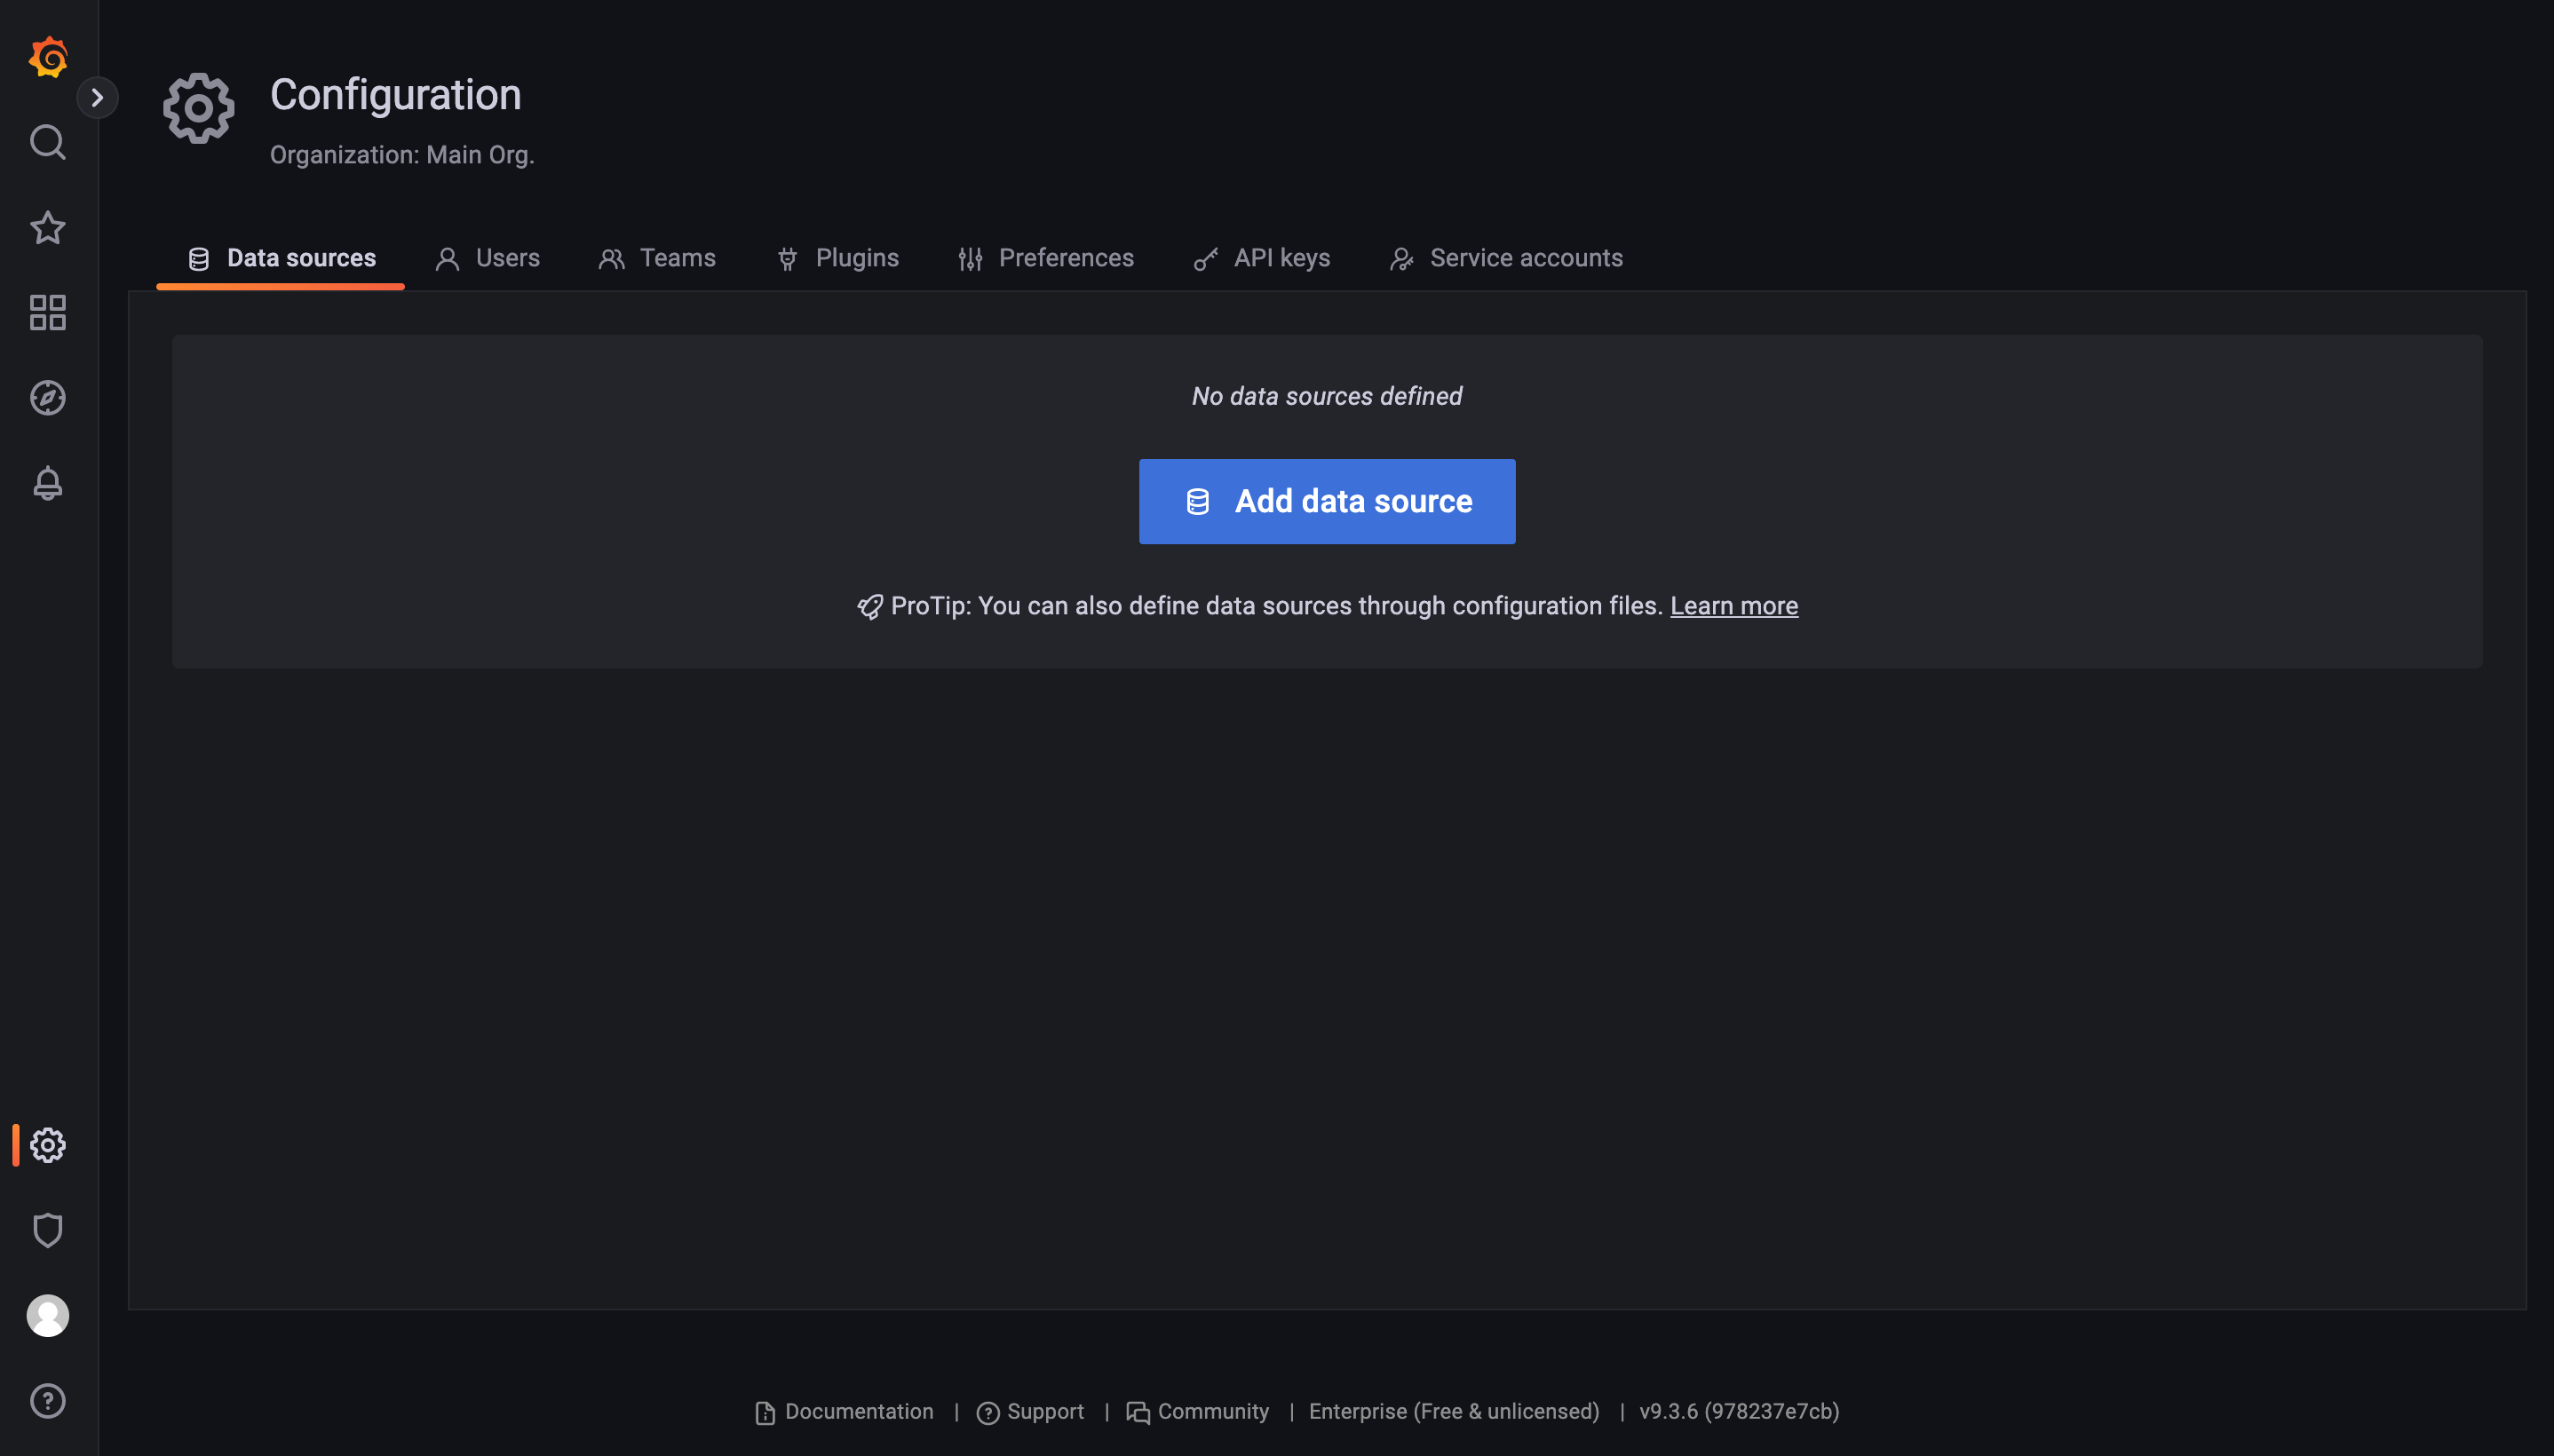
数据源
- configuration
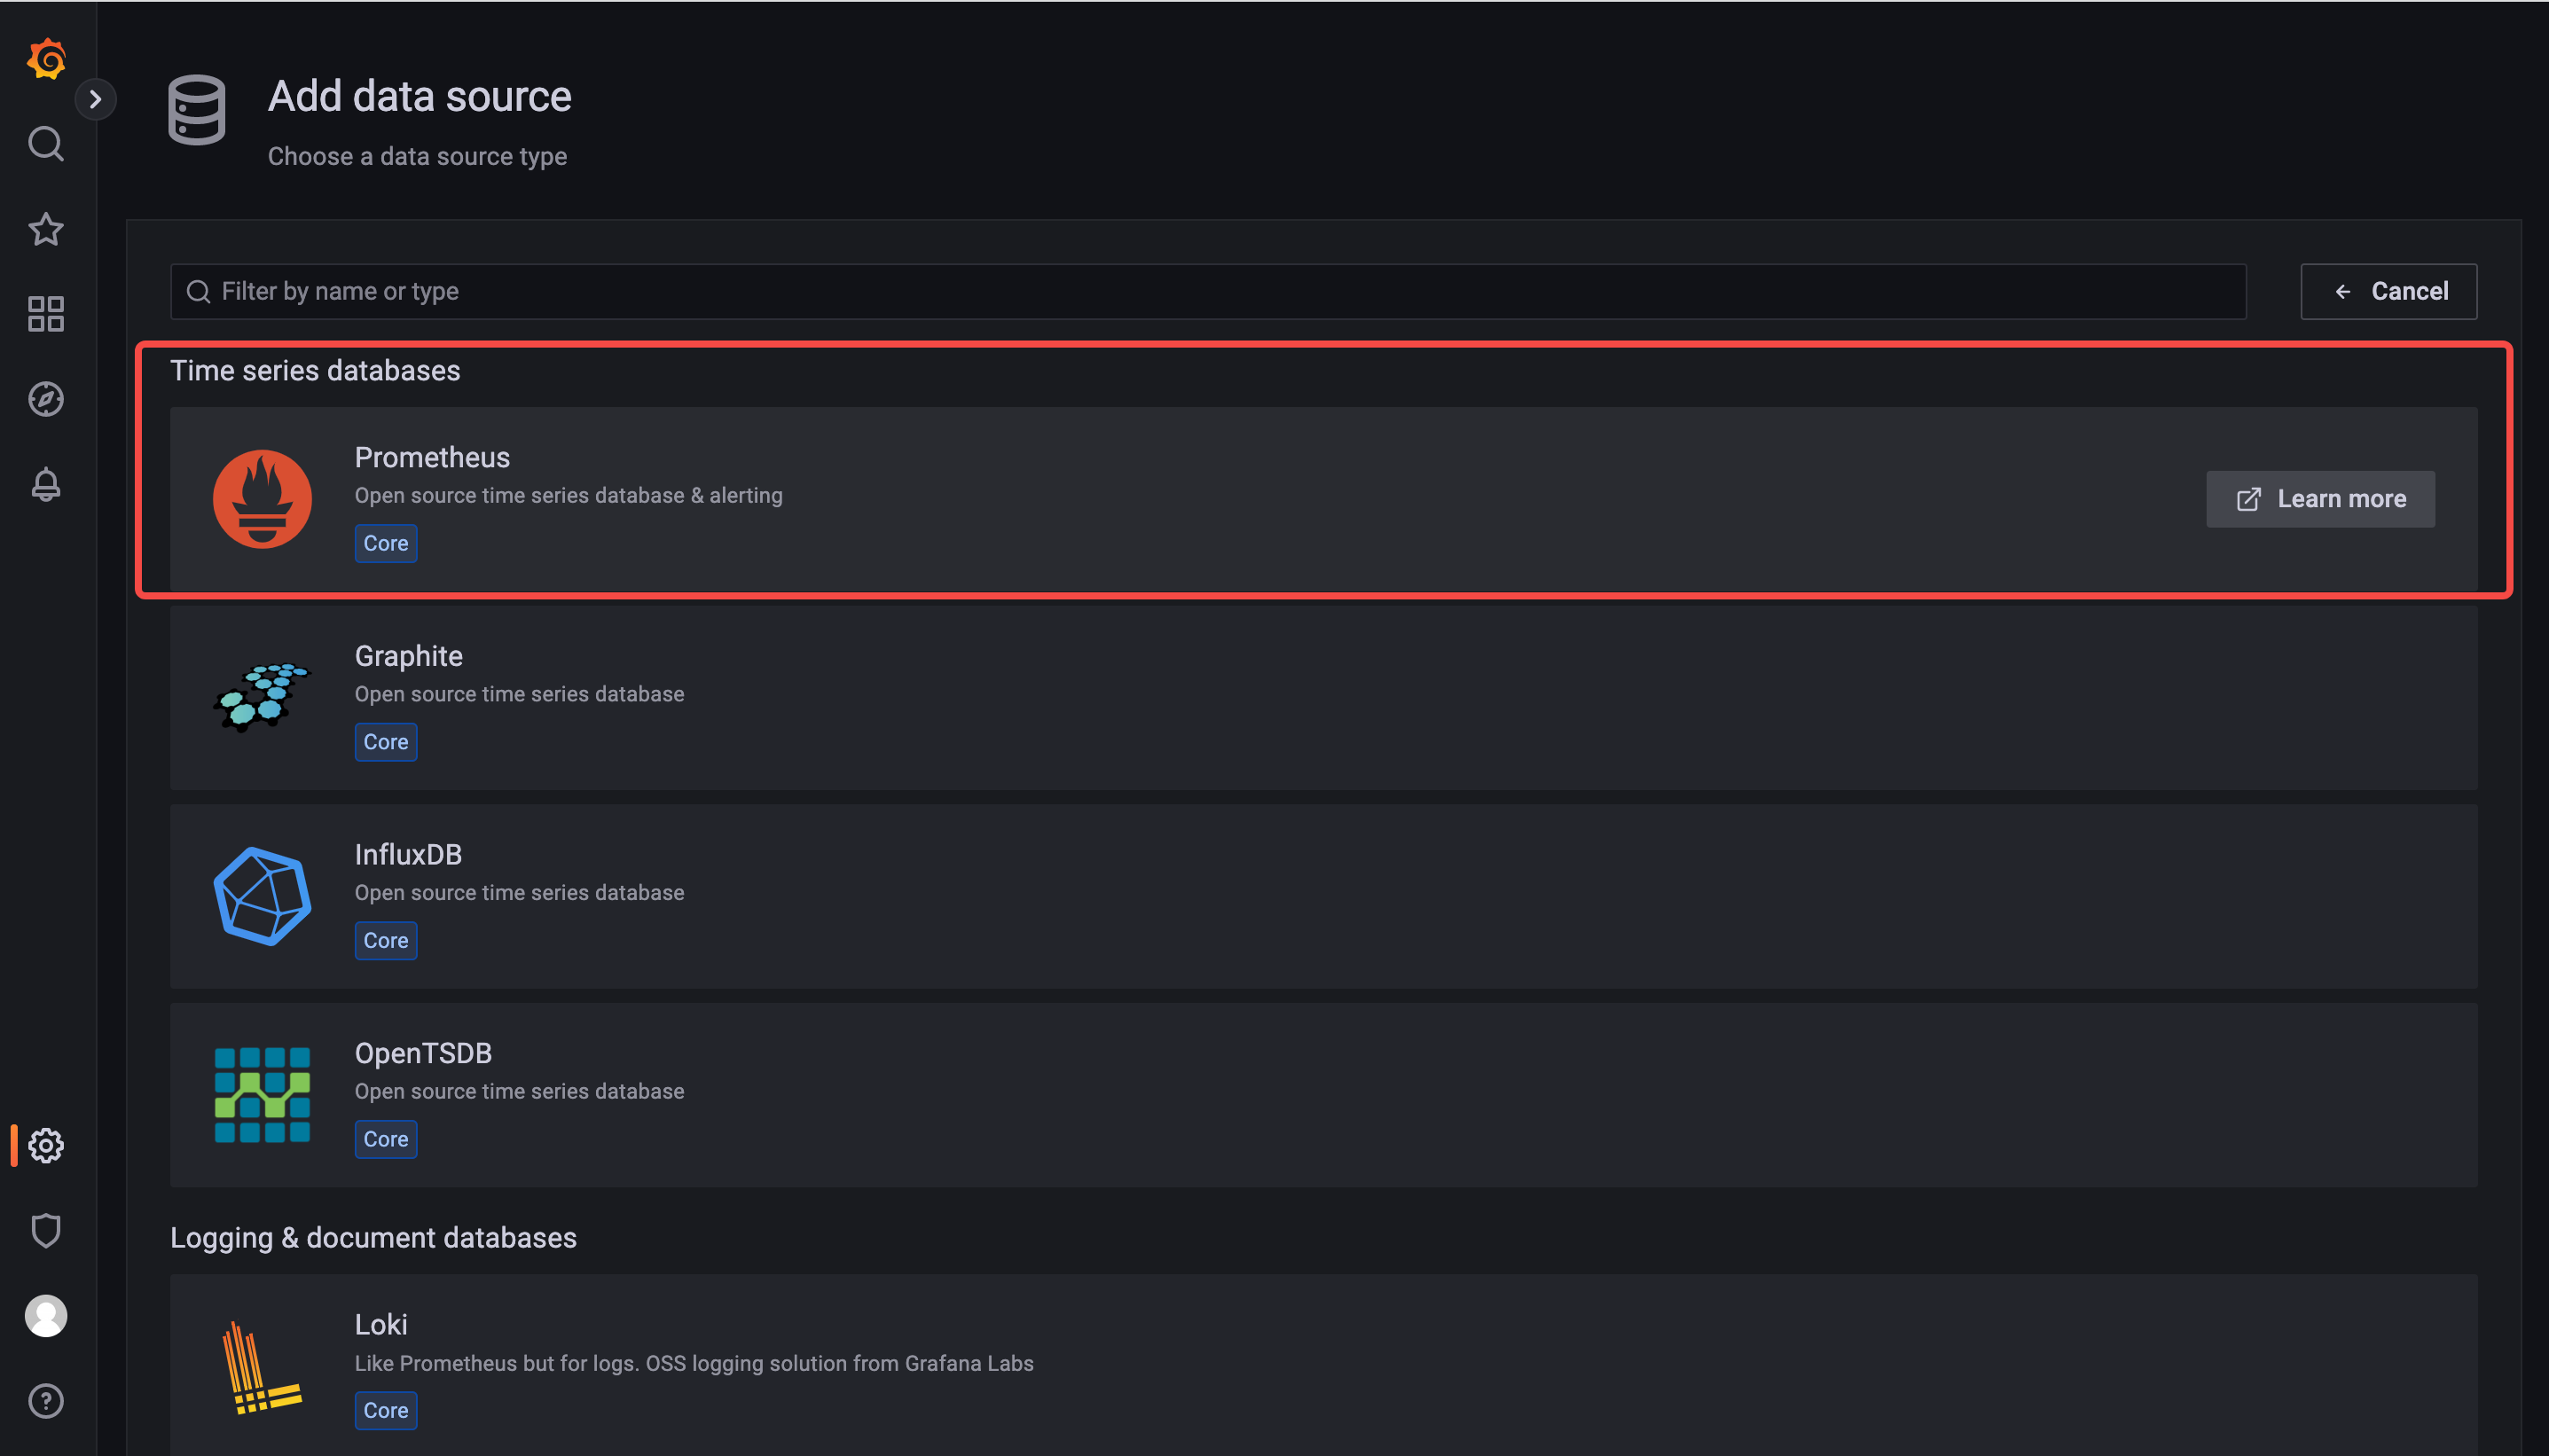
- add data source 选择 Prometheus
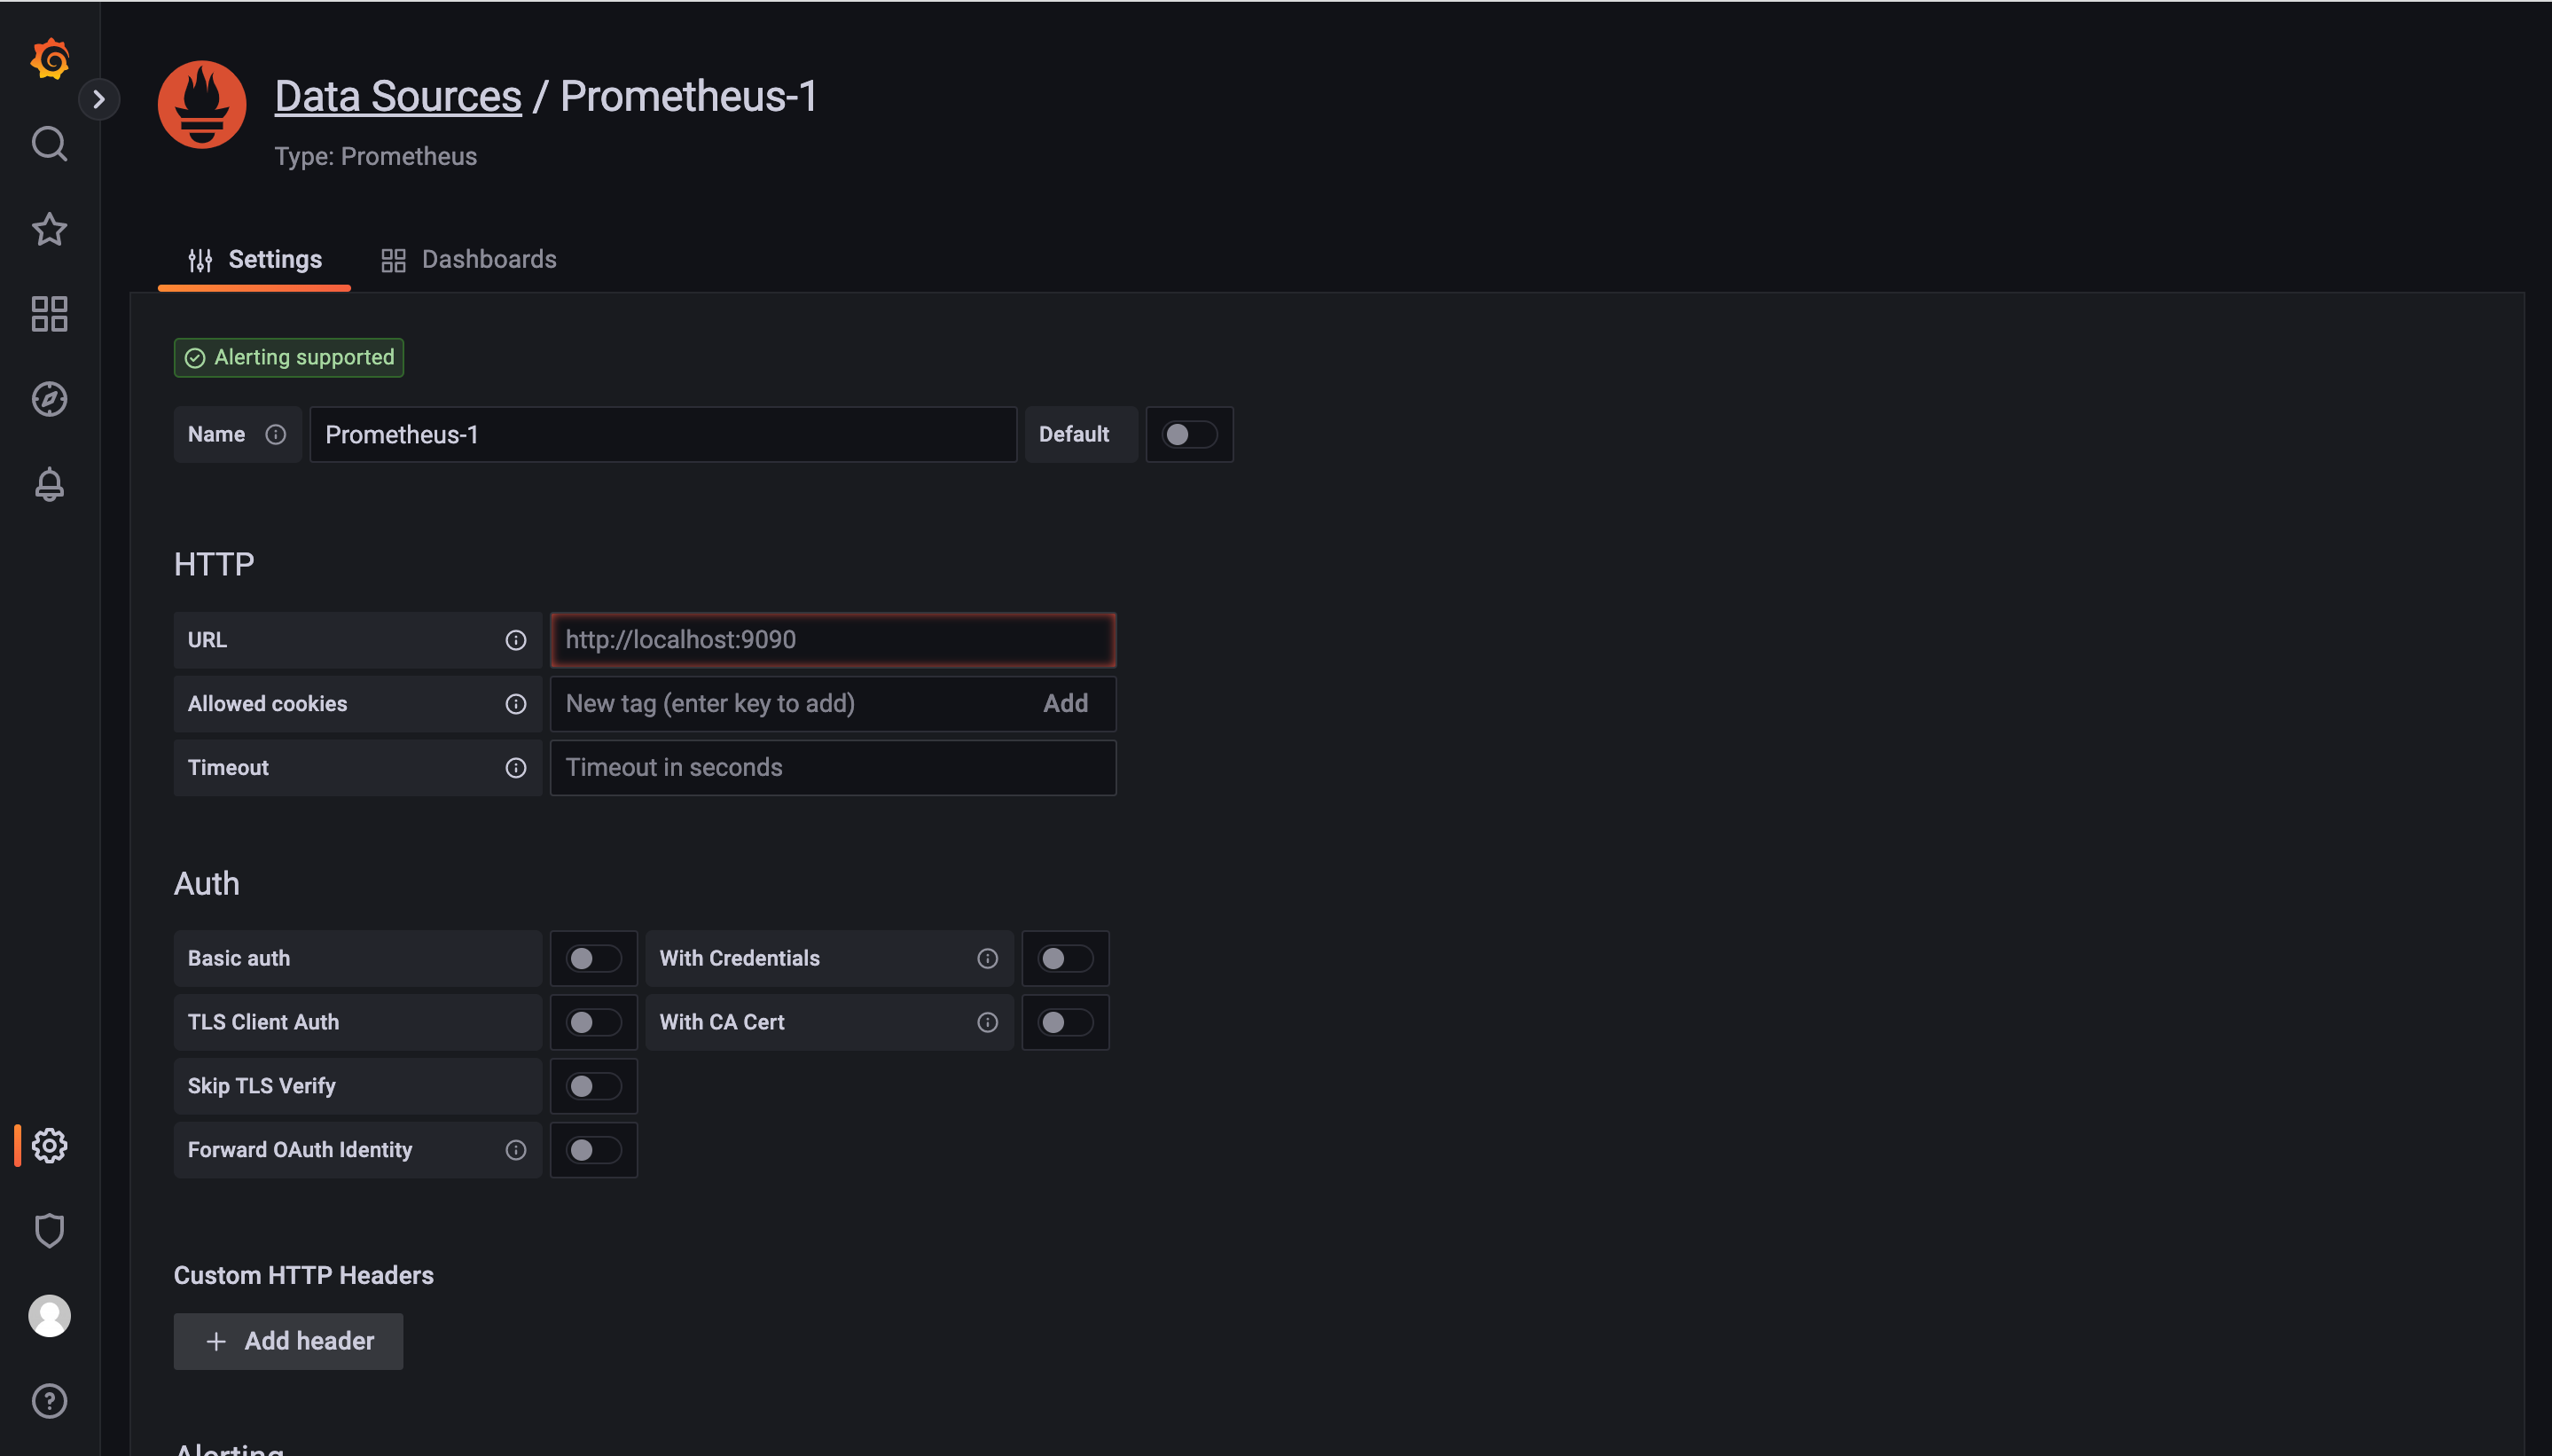
- 输入url 进行保存和测试
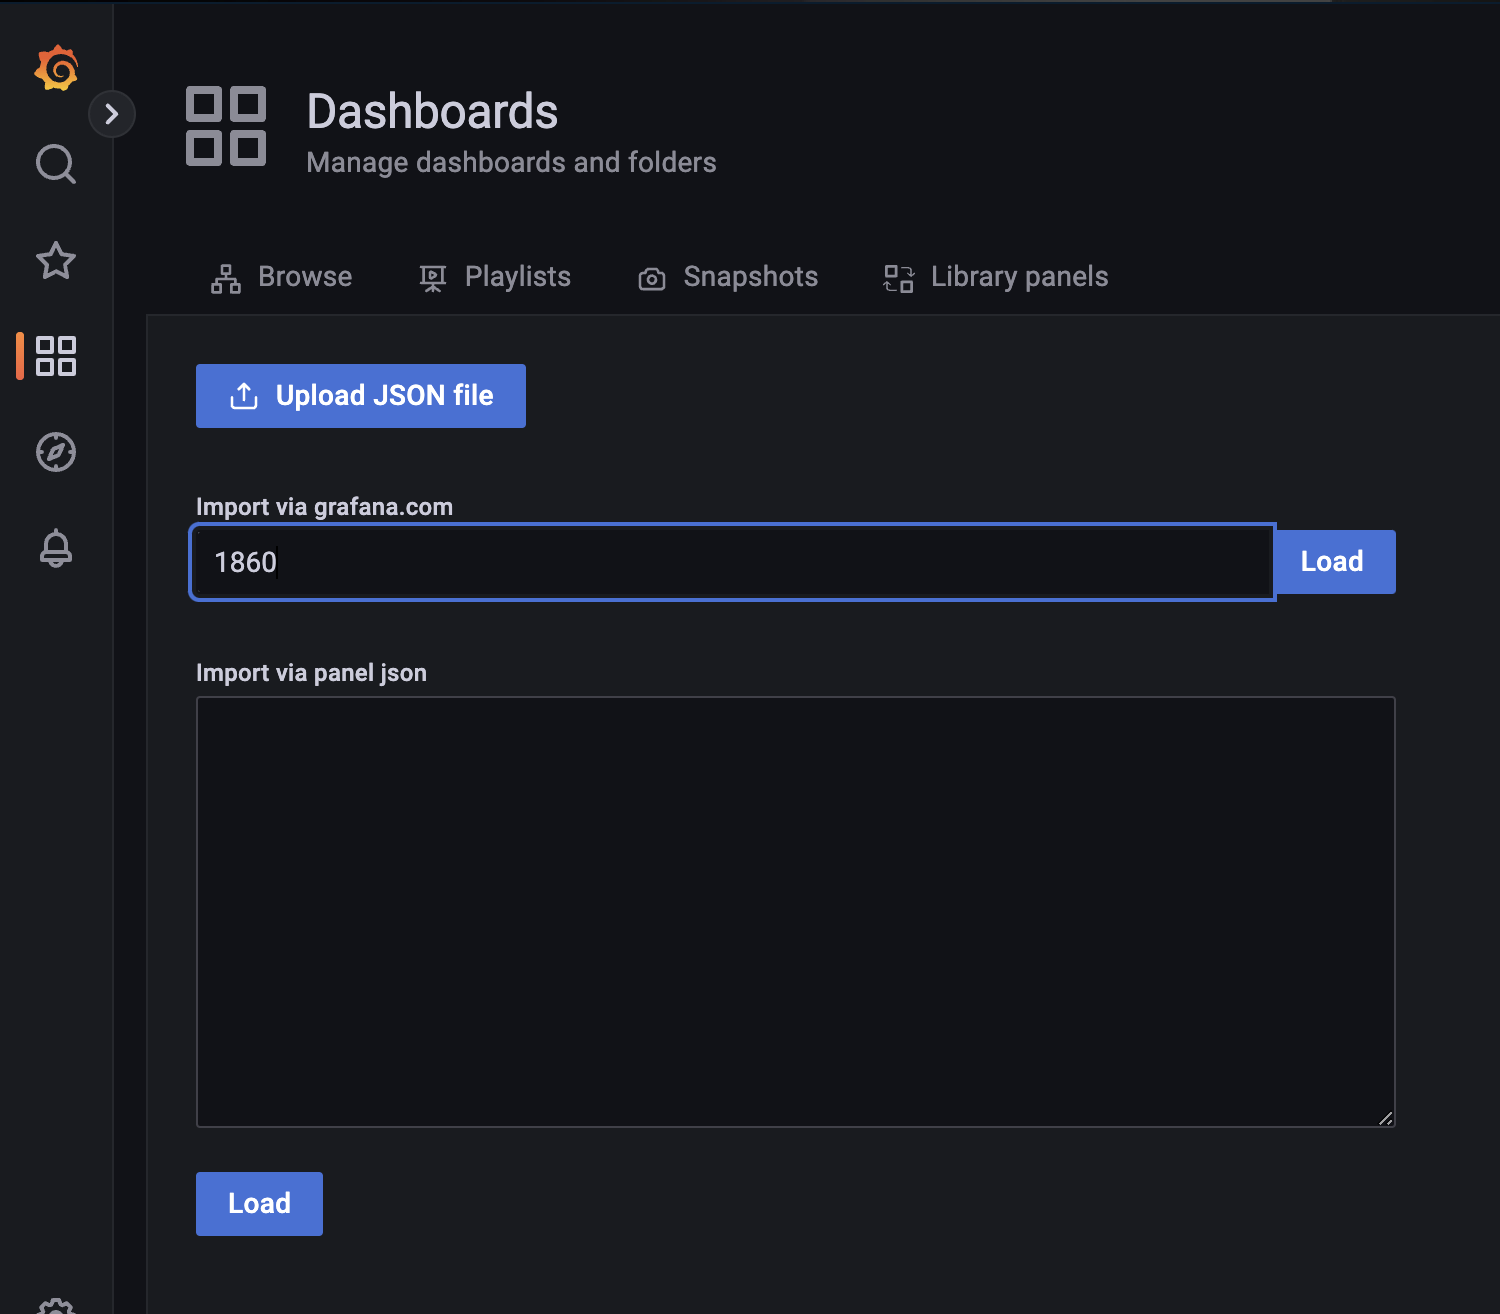
- 导入大盘
- 查看大盘数据
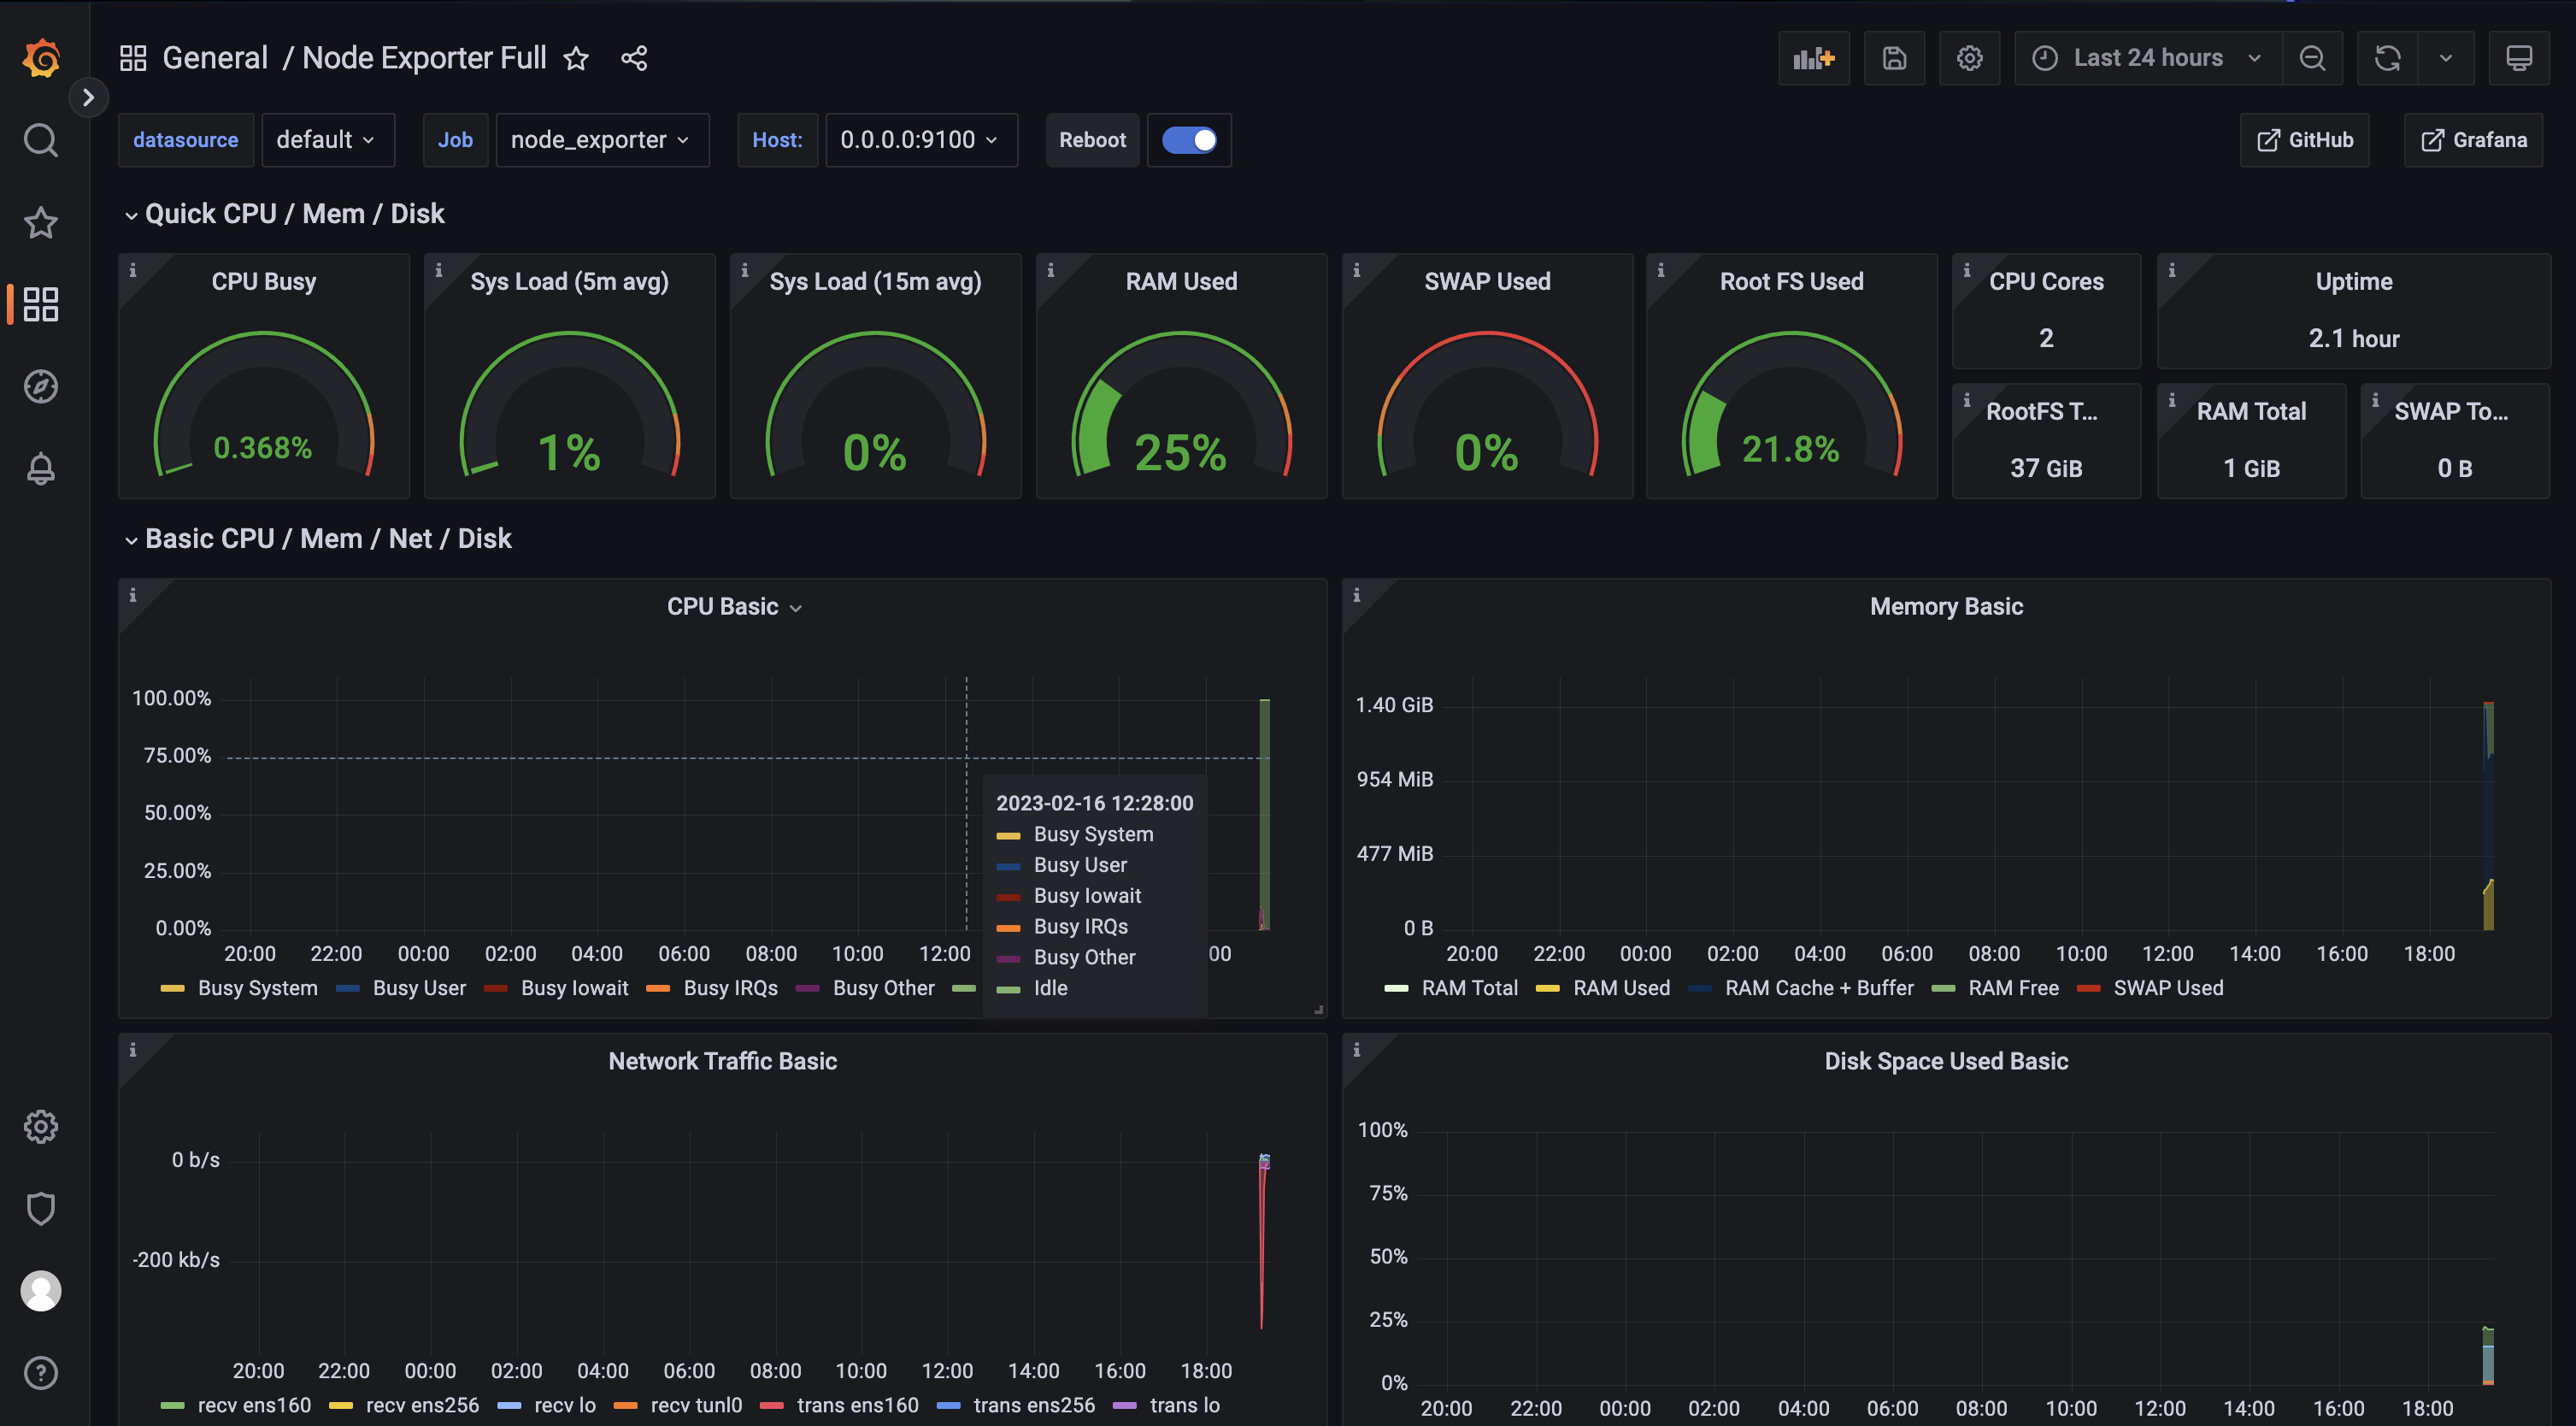
指标
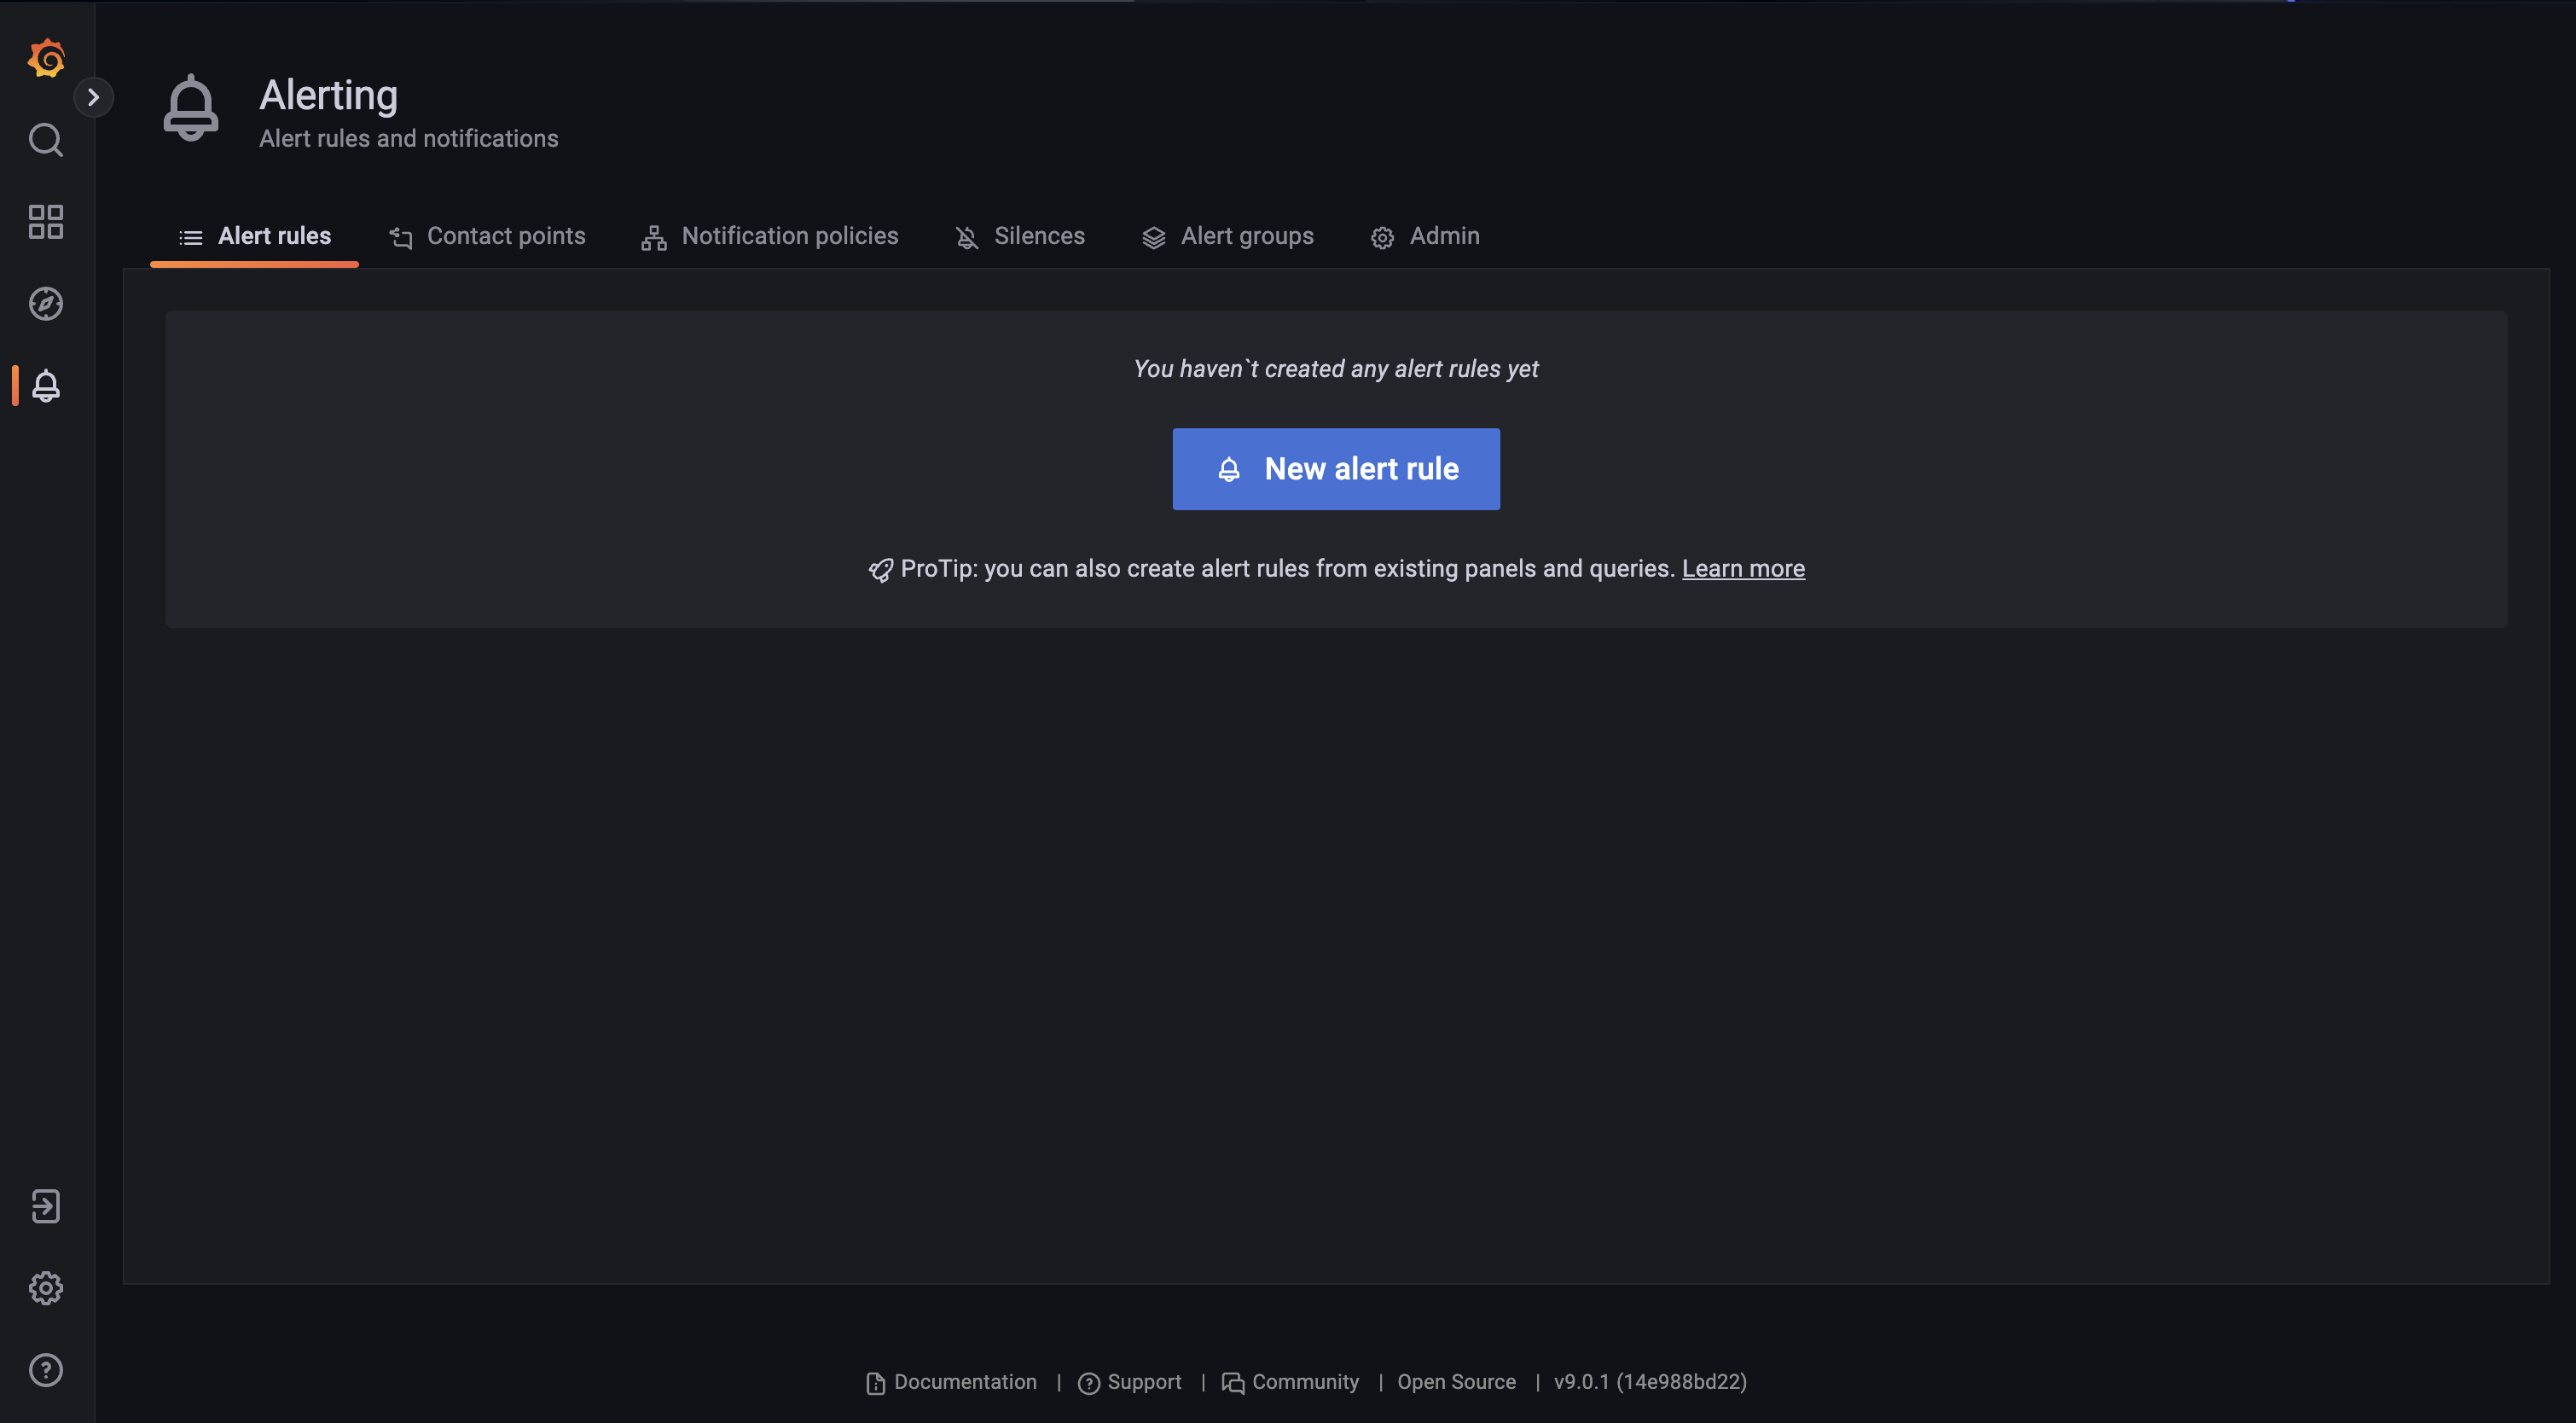
预警
创建预警规则
- 进入预警菜单创建预警规则
- 配置预警规则
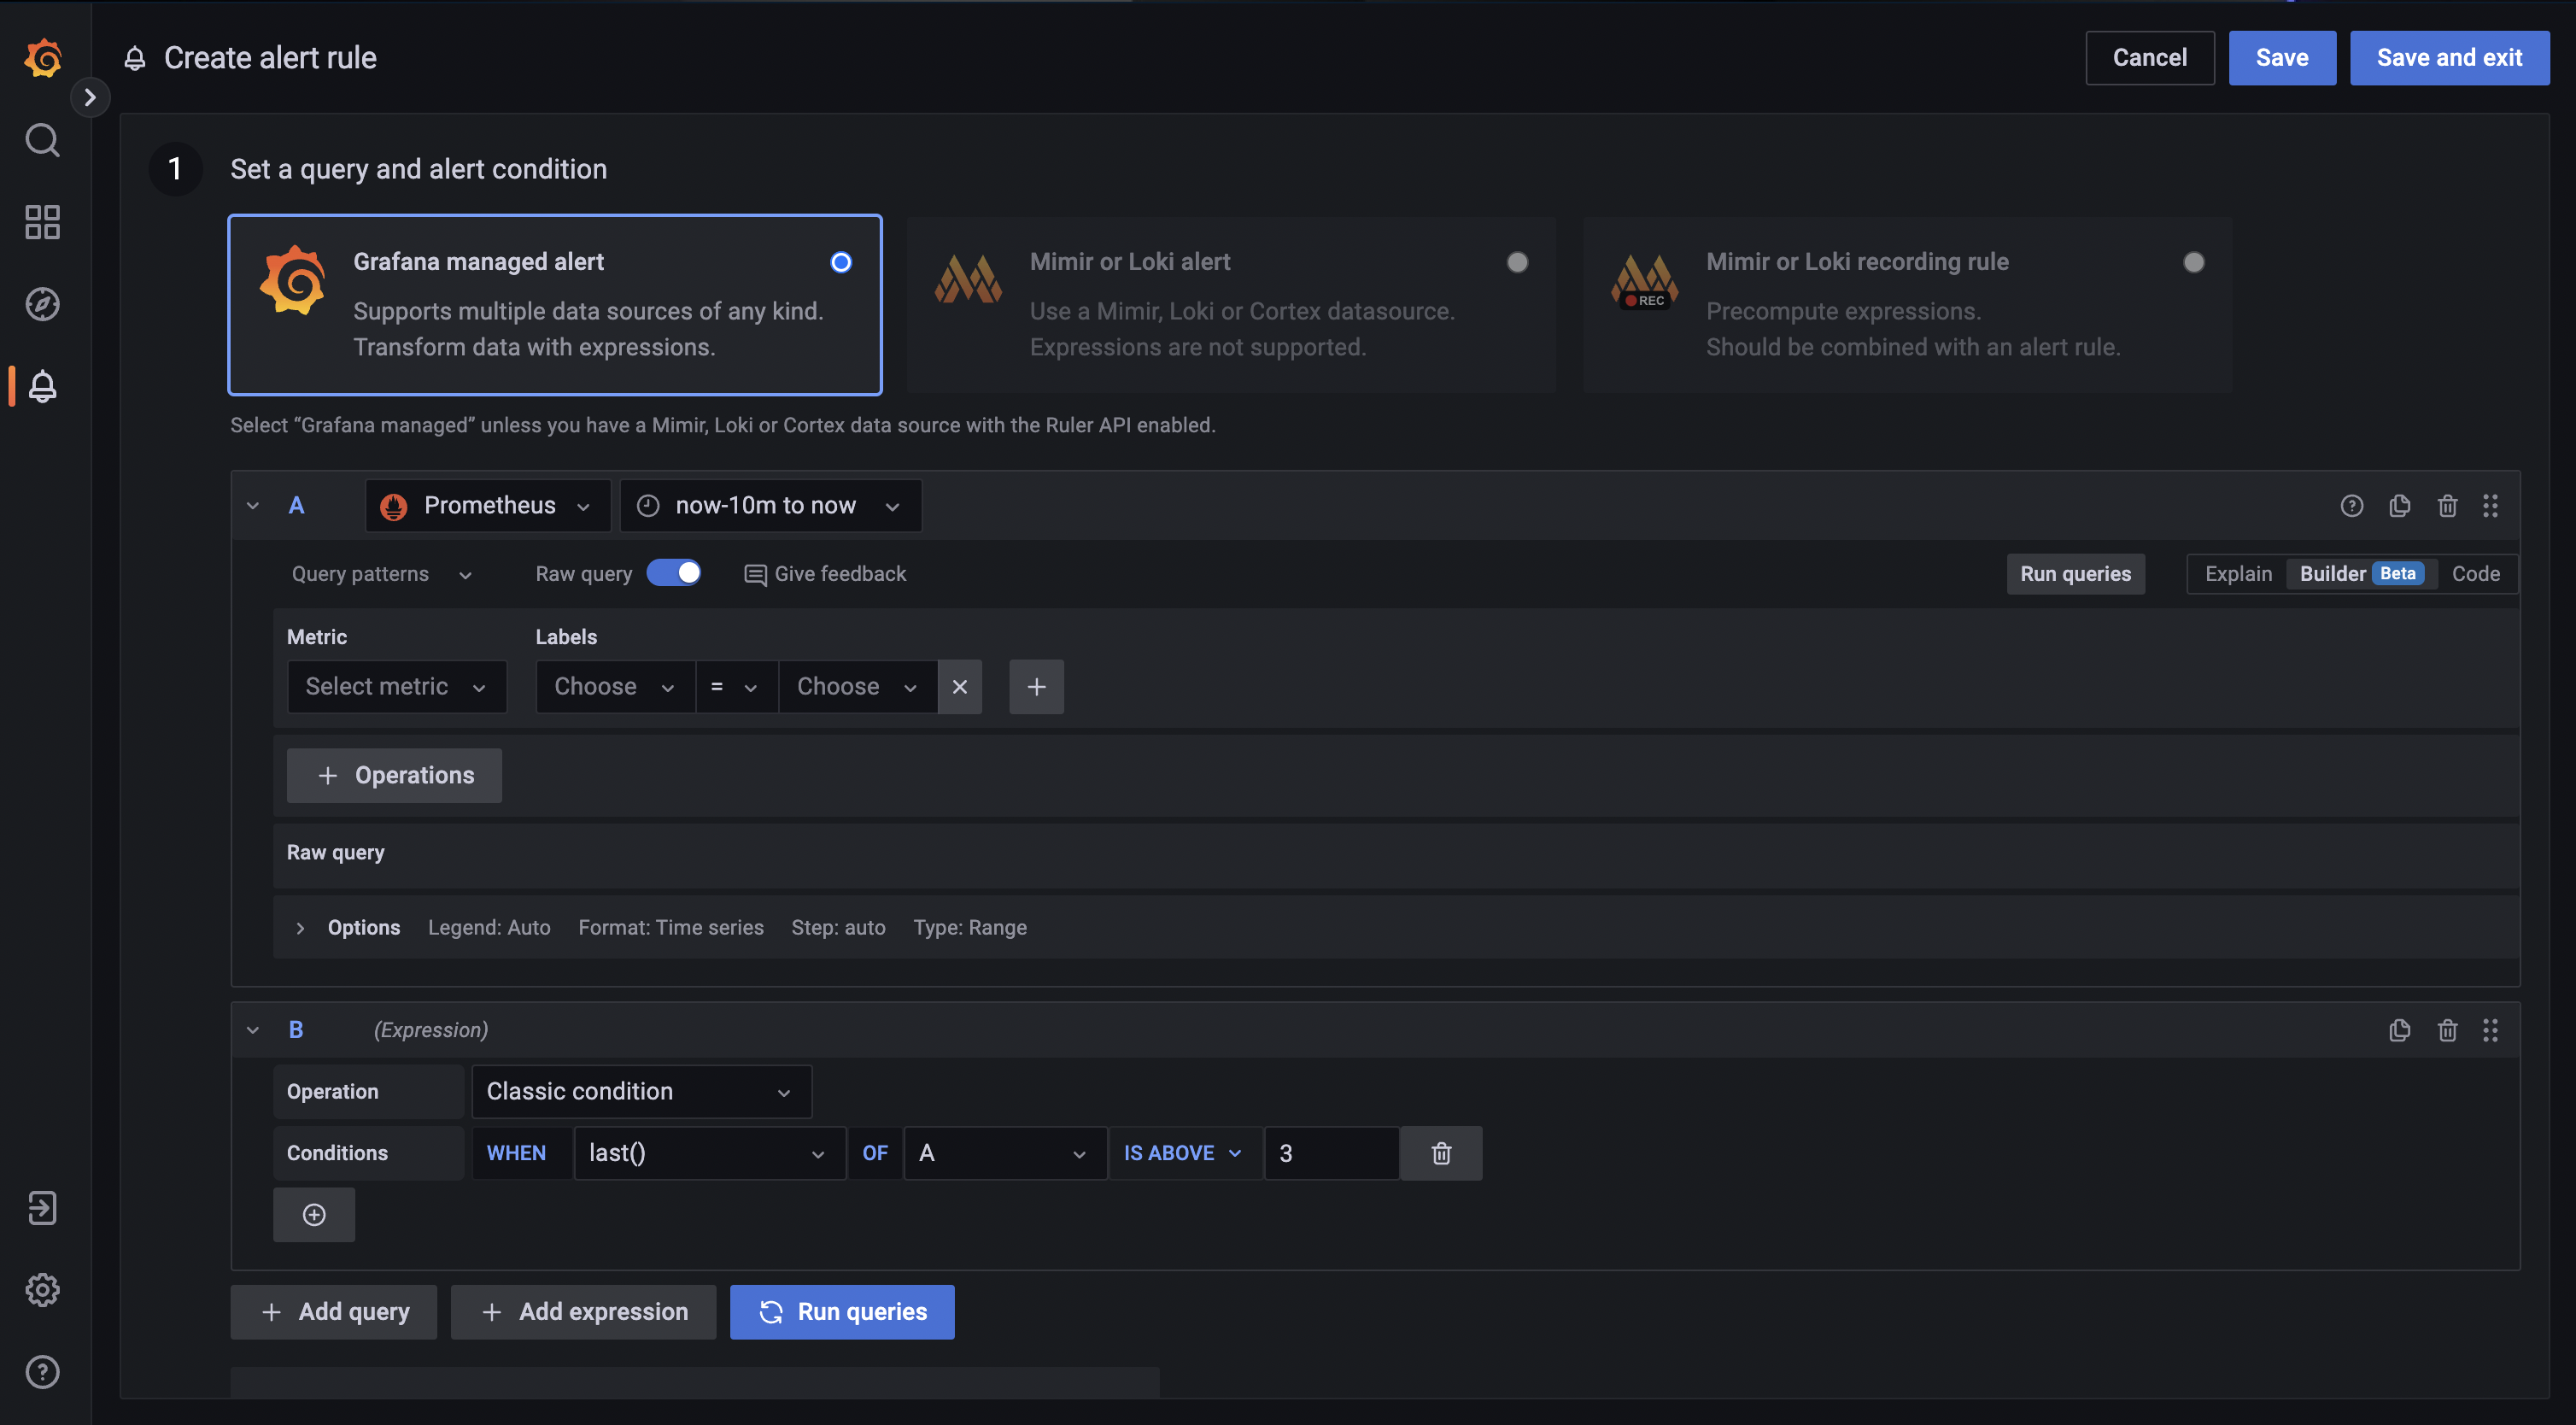
- 选择对应的数据源、时间范围、监控指标
资料
Grafana 监控可观测平台
https://mikeygithub.github.io/2020/05/25/yuque/Grafana 监控可观测平台/